New Provident Financial crash gives Neil Woodford a headache
15th January 2019 12:11
by Graeme Evans from interactive investor
A generous rally since October has unravelled quickly as most of Provident's rallies do. Graeme Evans has the key numbers and City view.

The patience of investors in Woodford-backed Provident Financial (LSE:PFG) is again being tested after a fresh stumble from the doorstep lender helped to unwind an impressive 33% surge in shares seen since October.
Today's fall of as much as 22% to 505.4p leaves Provident back where it was in early November, having said that profits would be at the lower end of market expectations of between £151 million and £166 million.
While Provident is making progress on several fronts, the reason for today's downgrade is firmly at the door of Vanquis Bank, which offers credit cards to people who are typically declined by mainstream providers.
New account bookings for Vanquis are down in the fourth quarter, but the main disappointment is the pressure on delinquency and arrears metrics in the second half of the year. This reflects increased use of payment arrangements as regulators look for lenders to offer more forbearance to customers.
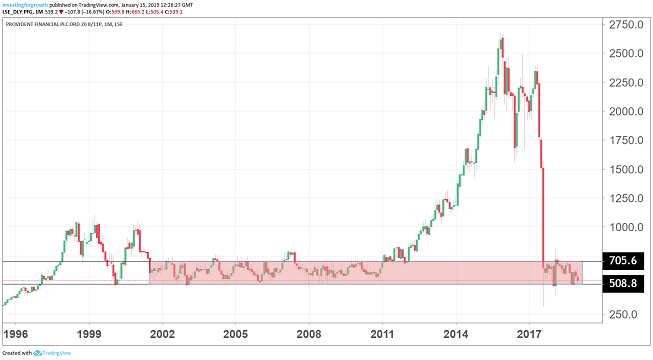
Source: TradingView, monthly chart (*) Past performance is not a guide to future performance
Cenkos analysts said the downgrade was not self-inflicted, adding that investors should not lose sight of the gains made by Provident in the past year, with a stronger balance sheet and improved relationship with regulators.
"Recoveries never happen in a straight line, and Provident has not proven an exception," they wrote.
Indeed, a glance at the chart above shows Provident's favoured trading range since 2001 roughly between 500p and 700p (pink strip). After a specular rally between 2011 and 2015, and equally spectacular decline in 2017, the share price has settled nicely back into the same range.
Significantly, Provident continues to expect a resumption of dividend payments in forthcoming annual results, with a "nominal" payment forecast by analysts to be between 8p and 10p. A subsequent policy of 1.4x cover has meant prospective dividend yields of 5.7% and 7.4% for the following two financial years.
Despite this, Cenkos said price/earnings (PE) multiples of 12.4x for 2019 and below 10x the following year hardly reflected a "recovery story that the market was banking on".
They added:
"Sentiment will have to ride this stumble, but it is just that - a stumble not a trip. There is value here, hence our 'buy' recommendation".
- Six speculative UK share tips for 2019
- Best funds and trusts for exposure to UK bargain shares
- The UK banks to buy in 2019
Neil Woodford is among investors to have stuck by Provident, having supported a £300 million rights issue at a cut price 315p last March. Woodford Investment Management holds 24% of the business.
It's worth remembering that shares had been changing hands at more than 2,000p until former boss Peter Crook's ill-fated plan to overhaul the lender's doorstep collection model by replacing self-employed agents with full-time staff.
The restructuring backfired and the company also found itself the subject of two regulatory investigations. One of these resulted in Vanquis having to refund one million customers of its Repayment Option Plan, a process now nearing completion.
So far, new CEO Malcolm Le May has delivered on the promises made at the time of that March fundraising.
Numis Securities said it was encouraging that the high-margin home credit business had performed a little better than expected in the fourth quarter, with a recovery in lending and a stable credit and collections. Moneybarn, which provides car finance to about 62,000 consumers unable to get mainstream credit, grew fourth quarter new business volumes by 21% on a year earlier.
Numis analyst James Hamilton said:
"Vanquis and Moneybarn remain dominant players in their chosen markets, delivering very attractive returns and growth profiles. They are growing despite having appropriately tightened their credit criteria."
Numis has a target price of 828p, while Autonomous analyst Ian White is at 727p. He said today's fall looked to be overdone, particularly as changes made to the business model since 2017 have left the company well-placed to meet regulatory changes within the home credit market.
*Horizontal lines on charts represent levels of previous technical support and resistance. Trendlines are marked in red.
These articles are provided for information purposes only. Occasionally, an opinion about whether to buy or sell a specific investment may be provided by third parties. The content is not intended to be a personal recommendation to buy or sell any financial instrument or product, or to adopt any investment strategy as it is not provided based on an assessment of your investing knowledge and experience, your financial situation or your investment objectives. The value of your investments, and the income derived from them, may go down as well as up. You may not get back all the money that you invest. The investments referred to in this article may not be suitable for all investors, and if in doubt, an investor should seek advice from a qualified investment adviser.
Full performance can be found on the company or index summary page on the interactive investor website. Simply click on the company's or index name highlighted in the article.