The next 'hidden liquidity problem' that could erupt
We reveal a key danger lurking behind exchange traded funds.
25th September 2019 10:24
by Ceri Jones from interactive investor
We reveal a key danger lurking behind exchange traded funds.

The gating of Neil Woodford's flagship Equity Income fund in early June has alarmed investors. However, Woodford invested the fund in small and unquoted stocks that are difficult to sell quickly, listing some stakes in unquoted companies in Guernsey simply to circumvent the regulator's rule that caps at 10% of net asset value (NAV) the proportion of unlisted securities an open-ended fund with daily dealing can hold.
In fact, by the end of last year, 85% of the fund's NAV was invested in illiquid securities, both listed and unlisted, as Woodford was forced to sell his more established holdings, such as FTSE 350 stocks. As the fund shrank to £3.8 billion from its £10.2 billion peak two years ago, gating became inevitable.
The Woodford debacle has highlighted the risks to investors of hidden liquidity problems. Ironically, exchange traded funds (ETFs), which are marketed to investors as a cheap and safe means of accessing certain asset classes, have systemic weaknesses. One of their selling points is that they provide instantaneous liquidity at reasonable bid-offer spreads.
However, ETFs have grown so rapidly that they now dominate the market and signs from the market meltdown at the end of last year suggest that a crisis could trigger a wave of sell-offs, in which retail investors would likely be hardest hit.
A $5.6 trillion sector
According to JPMorgan, there are now more than 8,400 ETFs, and their assets under management (AUM) climbed from $5 trillion to $5.6 trillion in the year to April 2019. This growth has created a bubble-like momentum. Having beaten active managers, ETFs have attracted more money, and as more investors pile in, the price of the underlying stocks being purchased soars.
Passive investing selection methods favour large caps when identifying constituents based on style factors such as momentum or growth, or investment themes, and this could mean the largest companies are getting overvalued. This phenomenon helps to account for the success of the large cap indices this year, and the record levels seen by the likes of the Dow Jones Industrial Average, the S&P 500, the FTSE 100 and Germany's DAX.
Vulnerable in a crisis
Because ETFs are based on indices, they are particularly vulnerable in a crisis, as they tend to be sold indiscriminately whenever an asset class falls out of favour. The level of ETF trading volumes as a percentage of total stock-trading volumes is strongly correlated with market volatility, as investors trade more ETFs during volatile markets, particularly broad-based ETFs ideal for big macro repositioning. This in turn leads to greater hedging activity, which is achieved – you guessed it – by shorting or buying puts on ETFs.
In fact, some 80% of the stock market is now in the hands of automated buyers and sellers, if you count quant funds as well as ETFs, according to JPMorgan. Automated trading at this level has not yet been tested in a bear market – which is disconcerting.
In the fourth quarter of last year, when stocks tumbled globally, ETF trading volume (which generally represents around 25-30% of total average US equity trading volume) suddenly popped nearly 35% alongside a spike in market volatility.
Bond ETFs have become particularly popular, as investors look to ramp up their income at a time when banks and building societies are paying rock-bottom rates on deposits – and the challenges increase with inherently less liquid asset classes.
For example last November a drop in the oil price caused a sell-off in high-yield bond ETFs, partly because energy bonds make up a sizeable (15%) portion of benchmark indices focusing on so-called junk debt, and also because higher oil prices create concern about interest rate rises.
The low interest rate environment has also been encouraging corporations to buy back stock, in other words paying shareholders the market value of a share and re-absorbing it. But stock buybacks affect a company's credit rating if the business has to borrow money to repurchase its shares.
Many companies have consequently been downgraded to a BBB credit rating, and so the number of BBB companies in the investment-grade benchmarks has grown significantly. If there is now a downturn in the economy, these BBB companies could quickly be downgraded to junk status. In such an environment investors would flee high-yield debt funds in a disorderly fashion.
As well as ETFs, strategic income funds have proliferated. These are multi-strategy fixed income funds that use leverage, derivatives and illiquid securities to juice up returns, investing for example in leveraged loans, which typically pay around 8% to 10%, at the expense of liquidity. These funds bear more than a passing resemblance to collateralised debt obligations (CDOs), those packaged tranches of mortgage loans behind the market crash of 2007/08.
The regulators' name for these types of assets is Level Three, which essentially means their pricing can only be based on internal models rather than market prices. It was precisely the volume of difficult-to-value instruments in CDOs that led to the 2007/08 crisis. At the peak of that crisis, Level Three assets accounted for more than 100% of the equity of Citigroup, the second-largest bank in the US.
As with CDOs, it is very hard to know where the risks in the underlying assets of multi-strategy income funds ultimately reside. Strategic income funds sold to retail investors typically classify up to 7% of their assets as Level Three – but as they are not benchmarked in the usual way, this could be an underestimate. Again like CDOs, the funds levy high fees, creating every incentive for financial institutions to sell them.
A recent example of what can happen is Natixis' (EURONEXT:KN) H20 Allegro fund, which invests in illiquid, high-risk corporate bonds issued by private companies linked to German entrepreneur Lars Windhorst. Morningstar suspended its rating of the fund in June amid concern about the robustness of the team's security-selection process.
"Most managers would argue that these illiquid assets account for a small fraction of their funds' portfolios," says Vincent Deluard, head of global macro research at the BD Division of INTL FCStone Finance.
Ownership of corporate bonds by ETFs is rising rapidly
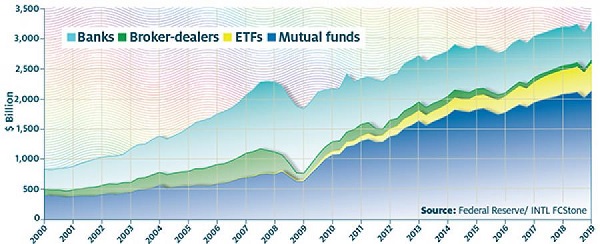
Note: Chart shows overall growth and breakdown of ownership of corporate bonds since 2000. ETFs now own 43 times as much as broker-dealers
Next liquidity event?
He continues: "It is hard to predict when or where a liquidity event will take place, but vulnerabilities have built up after a 10-year bull market. Trillion of covenant-lite securities have been issued. Most of them have been bought by unregulated investors in relatively opaque structures. A decade of financial repression and ruthless competition from passive strategies is a strong incentive for asset managers to search for yield in illiquid assets. Liquidity itself may prove to be an elusive concept at a time of widespread redemptions from open-ended funds. Mutual funds and ETFs now own 43 times as much in corporate bonds as broker-dealers. But banks have halved their holdings of corporate bonds since 2008, so it is hard to see who would provide liquidity if mutual fund and ETF investors want out (see chart)."
Deluard insists he is not a permabear but believes the last few months are the last stage of the secular bull market, and that a concern in the market which might in the past have prompted a 10% correction could now trigger one of the order of 30%. He expects the S&P to be significantly below 3000 by Christmas.
One way to tell if a liquidity squeeze is coming is to watch the spread between the price of the major bank loan ETFs and their NAV. The largest bank loan ETF traded at a 2% discount to its net asset value during last November's selloff. "The gap closed quickly and outflows were limited this time, but a sustained liquid crisis would likely spread to the rest of the market and expose the ghosts hiding in investors' closets," Deluard says.
This article was originally published in our sister magazine Money Observer, which ceased publication in August 2020.
These articles are provided for information purposes only. Occasionally, an opinion about whether to buy or sell a specific investment may be provided by third parties. The content is not intended to be a personal recommendation to buy or sell any financial instrument or product, or to adopt any investment strategy as it is not provided based on an assessment of your investing knowledge and experience, your financial situation or your investment objectives. The value of your investments, and the income derived from them, may go down as well as up. You may not get back all the money that you invest. The investments referred to in this article may not be suitable for all investors, and if in doubt, an investor should seek advice from a qualified investment adviser.
Full performance can be found on the company or index summary page on the interactive investor website. Simply click on the company's or index name highlighted in the article.