Obeying these rules generates outsized investment returns
Slater Investments reveal how a rationally constructed portfolio can beat the index consistently.
11th July 2019 09:58
Fund managers at Slater Investments reveal how a rationally constructed portfolio can beat the index consistently.

Fight or flight, fear or excitement? Investment management is an exercise in navigating between these two impulses. We need coherent systems to protect us from the impulses of fear and greed, panic and exuberance.
The Slater funds have been managed on the basis of selecting companies which show consistent earnings growth but are not yet priced to deliver the growth we expect. After initial filtering according to financial criteria we then look to analyse companies closely, ideally by meeting the management more than once before taking the plunge.
But could we dispense entirely with meeting companies and let the financial filtering do all the work? We spent some time this spring backtesting various strategies against larger companies around the world. Using data provided by ThomsonReuters we looked back 15 years.
Going back further can be difficult as the coverage becomes patchy. The idea is to test which strategies would have worked best using the profit records and forecasts available at the time.
The results were both surprising and comforting. The surprise was that markets, even for large companies, are not genuinely efficient even when armed with quantities of data. This means that a rationally constructed portfolio can beat the index consistently.
In an efficient market this would be unlikely after a year or two, growing more unlikely year by year. The comforting element was that our work showed that strategies using Slater principles worked very well. The decisions relied purely on the data available to all and sundry: no private nods or winks, no Olympian insights into economic trends.
The results
| 15 years to 30 April 2019 | |||
|---|---|---|---|
| Years between reselection | 1 | 2 | 3 |
| Benchmark - TR Global Index | 7.20% | 6.70% | 7.20% |
| Universe of Slater Classic companies | 11.90% | 11.20% | 12.40% |
| Average number in universe | 127 | 130 | 110 |
| Best Slater fractile | 15.20% | 14.60% | 16.70% |
This table looks a little complicated but it tells an important message. The Slater companies were those that satisfied basic criteria, such as market value, historic profitability and cashflow performance.
These companies were then sorted according to their forecast growth on the one hand, the higher the better, and their price earnings (PE) multiple, the lower the better. The companies were grouped into eight fractiles, so there were generally about 16 in each of them.
You can see that the portfolio reselected each 30th April gave a 15.2% annual return, more than twice the market return. Interestingly, where we only reselected every third year we generated a slightly better return. Dealing costs are obviously lower with longer holding periods, so this is quite a bit more attractive.
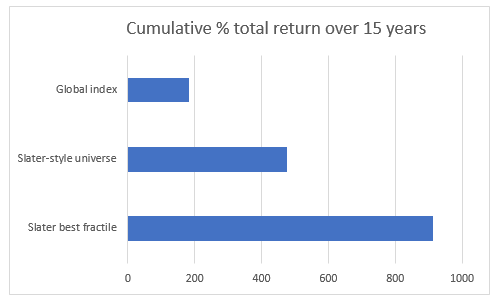
Thinking further about these results, a good tracker portfolio would have grown from 100 to 284 over the 15 years. The Slater universe would have turned 100 into 577 and the best fractile would have produced 1,014. That’s more than 3.5 times as much.
Conclusion
The performances here are not freakish. The Slater Growth Fund has generated returns similar to the Slater-style universe shown here, while our hedge fund has matched the performance of the best fractile. Following some basic rules can mean fighting our human instincts, but these results show it pays to obey the law.
These articles are provided for information purposes only. Occasionally, an opinion about whether to buy or sell a specific investment may be provided by third parties. The content is not intended to be a personal recommendation to buy or sell any financial instrument or product, or to adopt any investment strategy as it is not provided based on an assessment of your investing knowledge and experience, your financial situation or your investment objectives. The value of your investments, and the income derived from them, may go down as well as up. You may not get back all the money that you invest. The investments referred to in this article may not be suitable for all investors, and if in doubt, an investor should seek advice from a qualified investment adviser.
Full performance can be found on the company or index summary page on the interactive investor website. Simply click on the company's or index name highlighted in the article.