Oil stock analysis: Nostrum Oil & Gas
30th October 2018 11:34
by Rajan Dhall from interactive investor
Financial markets analyst Rajan Dhall picks out the day's key industry news and runs the numbers to see what this share price might do next.

Oil markets have continued to sell off recently as global trade issues and US oversupply hit the markets.
This morning we have had comments from the International Energy Agency (IEA) who say that cutting now would not be appropriate given current demand levels. IEA's Birol then went on to state that a higher oil price may be detrimental to global growth.
Prices are currently around $67 per barrel, which is far from the highs seen at the beginning of the month at around $76.88 per barrel.
Looking forward to later in the session we get the latest API readings from the States. Last time out there was a massive build of 9.880 million barrels and prices were sent tumbling.
But it's the production numbers from the Department of Energy data that are of real interest to market watchers. Before the busy summer months, US production was at a steady but high 11 million barrels per day, but since then they have only fallen by 300 thousand barrels.
Latest US production figures on Wednesday will make an interesting read.
Nostrum Oil & Gas
This morning, Nostrum released an operational update for the nine months ending 30 September.
The company, worth about £400 million, produced an average 31,757 barrels of oil equivalent per day (boepd) for the nine months, and expects revenue to be in excess of $310 million, $6 million more than last time out.
Nostrum's cash position has fallen slightly to in excess of $102 million versus $135 million in the first half of 2018.
In terms of forward guidance, following the suspension of Well 40 and the down time required to introduce the low-pressure system, Nostrum expects average sales volumes for the year to be above 30,000 boepd, but below previous guidance of 32,000 boepd.
This is slightly disappointing as market participants were hoping for a shorter delay.
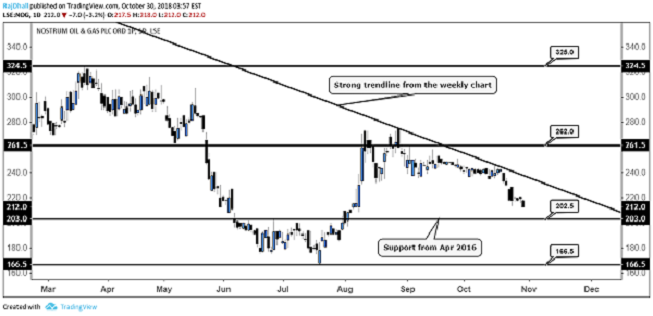
Chart analysis
Looking at the daily chart below, it's clear to see the downtrend from the weekly chart (diagonal black line) is still intact. As the trendline is so strong a break would indicate bullish momentum, but we are not there yet.
For now, we must look for support as the market is clearly underwhelmed by the latest report.
The psychological 200p area would be the first stopping point, as it had been used heavily before, back in April 2016. If that fails, the wave low of 166.6p on the chart may be strong enough to stem losses.
Candles are still showing bearish momentum and there has not been any rejection of lower prices. If there is at some stage, investors should watch the volume to see if it supports a bounce back.
Source: TradingView Past performance is not a guide to future performance
Rajan Dhall is a freelance contributor and not a direct employee of interactive investor.
These articles are provided for information purposes only. Occasionally, an opinion about whether to buy or sell a specific investment may be provided by third parties. The content is not intended to be a personal recommendation to buy or sell any financial instrument or product, or to adopt any investment strategy as it is not provided based on an assessment of your investing knowledge and experience, your financial situation or your investment objectives. The value of your investments, and the income derived from them, may go down as well as up. You may not get back all the money that you invest. The investments referred to in this article may not be suitable for all investors, and if in doubt, an investor should seek advice from a qualified investment adviser.
Full performance can be found on the company or index summary page on the interactive investor website. Simply click on the company's or index name highlighted in the article.