Private Investor Index shows older investors outperform younger ones in Q1
Our newly launched index shows how retail investors fared through the first quarter of 2021.
13th April 2021 20:07
by Jemma Jackson from interactive investor
Our newly launched index shows how retail investors fared through the first quarter of 2021.

In January 2021, interactive investor launched its Private Investor Index, which showed that retail investors beat the market in 2020, with younger investors outperforming older investors.
Today, interactive investor, the UK’s second-largest DIY investment platform, has published its updated index*, showing the average interactive investor customer portfolio, in median terms, is up 32.09% over the year to end March 2021, ahead of the FTSE All-Share.
In quarter one 2021, the average interactive investor customer saw growth in the value of their portfolios of 2.91%, underperforming the FTSE All-Share. The 65-plus age category performed the best in Q1, with the youngest age group 18-24 performing the worst. It is important to emphasise that one quarter is a very short period of time.
Richard Wilson, CEO, interactive investor, says: “This index won’t always make for comfortable reading, but we want it to be a useful barometer of how retail investors are faring, through all market conditions.
“In quarter one, and during a time when the FCA sensibly warned that younger investors are taking on too much risk, we saw the tables turn in favour of older generations, in median average performance terms.
“Yet our youngest adult customers are still outperforming all other generations over the past year, and the past 15 months too. They were perhaps boosted, for now at least, by having the highest investment trust exposure, which represented 35% of the median average portfolio among 18–24-year-olds. While diversified technology holdings were popular, individual tech stocks were hard to find among this age group, at least among top-ranked holdings, [illustrating] how difficult it is to generalise about investors.”
Moira O’Neill, Head of Personal Finance, interactive investor, adds: “The 12 months to 31 March 2021 saw the average ii customer outperform the UK market by five percentage points, and by 1.51% over the past 15 months. The US market remains stubbornly hard to beat, but few would want to put all their eggs in one market – portfolio diversification is important.
“For me, the most uncomfortable reading is the slight underperformance of our female customers versus our male customers. Women are holding fewer North American direct equities, and more UK, at a time when the US market has trounced the UK. While the tables may at some point be reversed, I would urge all investors to take a close look at their geographical exposure. If you have a clear home bias, it might be worth making some nips and tucks to your portfolio in the interests of balance.”
The index looks at the past quarter, year and 15 months. Going forward, the index will incorporate longer-term data, updated quarterly.
Quarter 1 performance
In quarter one 2021, the average interactive investor customer, in median terms, saw growth in the value of their portfolios of 2.91%. But it was the 65-plus age category which performed the best, up 3.21%, followed by the 55-64 age category (up 2.85%), closely tracked by the 45-54 age category, up 2.82%. The worst-performing age group in Q1 was 18–24-year-olds, who were up 1.78%, followed by 25–34-year-olds, up 2.11%.
All age categories trailed the FTSE World Index, which was up 4.09%, while the FTSE All-Share did even better after a poor 2020, up 5.19%.
The outperformance of the 65-plus age group could be in part due to lower cash weightings in a rising market, and their low exposure (in median average terms) to tech stocks such as Apple (NASDAQ:AAPL), Tesla (NASDAQ:TSLA) or Amazon (NASDAQ:AMZN), which had a shaky Q1. No tech stocks appeared in the top 10 holdings by value (in median average terms), among the over-65s.
Yet during a quarter in which the FCA warned that some younger investors are taking on too much risk, in median average terms, this does not seem to be an overall trend among interactive investor customers. In fact, the absence of tech stocks in the 18-24 age category is notable, although Apple, Amazon and Tesla all feature in the top 10 among 25–34-year-olds and in the 35-44 age group.
Looking (a little) further back – one year and 15 months
The average interactive investor customer portfolio is up 32.09% over the last year to end March 2021, ahead of the FTSE All-Share, which was up 26.71%, but behind the FTSE World Index, which was up 39.93%.
Over the past year, 18–24-year-olds are leading the charge, up 36.89% in median average terms, followed by the 24-34 age category, up 34.04%. The 65-plus age category performed the worse over the past year, up 30.49%.
But while the past year shows some impressive gains, the past 15 months, have been less kind. The average ii customer portfolio is up 4.7%, ahead of the FTSE All-Share gain of 3.19%, but trailing the FTSE World, up 13.48%.
Over this 15-month period, the 18–24-year-old age group again performed the best, up 10.61%, followed by the 25-34 age camp, up 9.45%. The 65-plus age group performed the worse, up 1.88%.
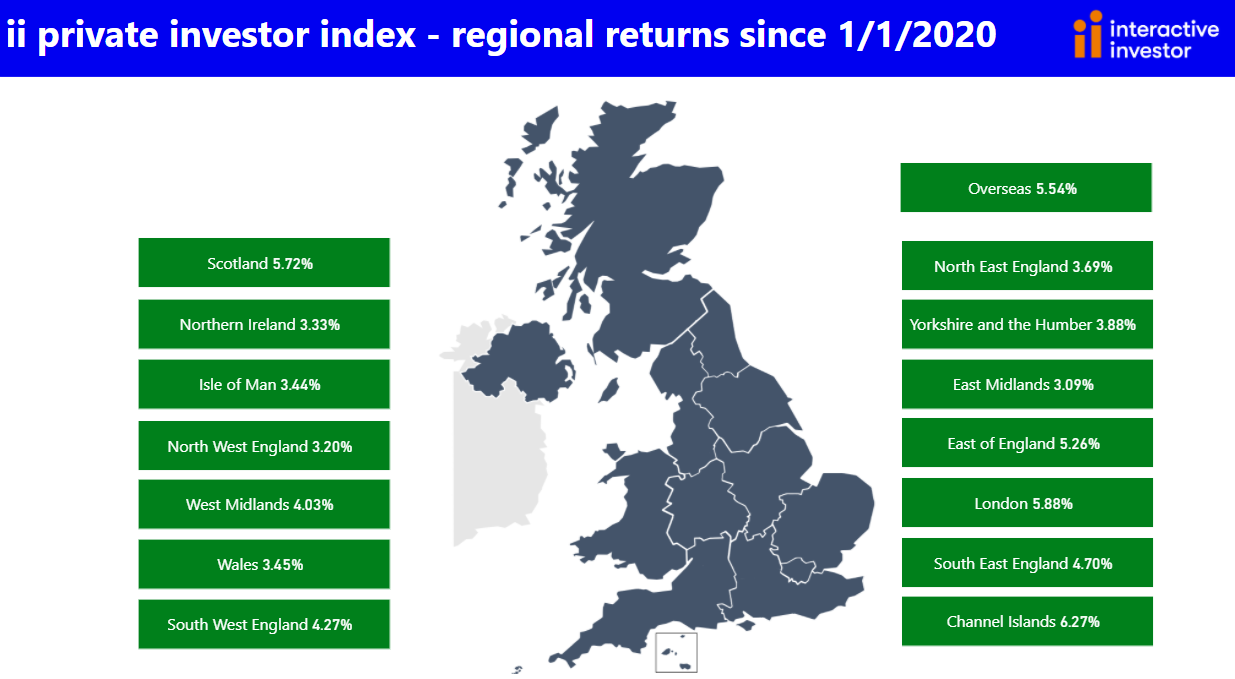
Regions
In quarter one 2021, it was customers in the Isle of Man who performed the best, up 3.65%, followed by Wales (3.43%), and the North East of England (3.40%).
Over the last year to end March 2021, it was again the Channel Islands that performed the best (up 34.73%), followed by the Isle of Man (33.75%) and Scotland (33.61%).
Over the last 15 months, the Channel Islands is again performing the strongest, up 6.27%, London (5.88%) and Scotland (5.72%).
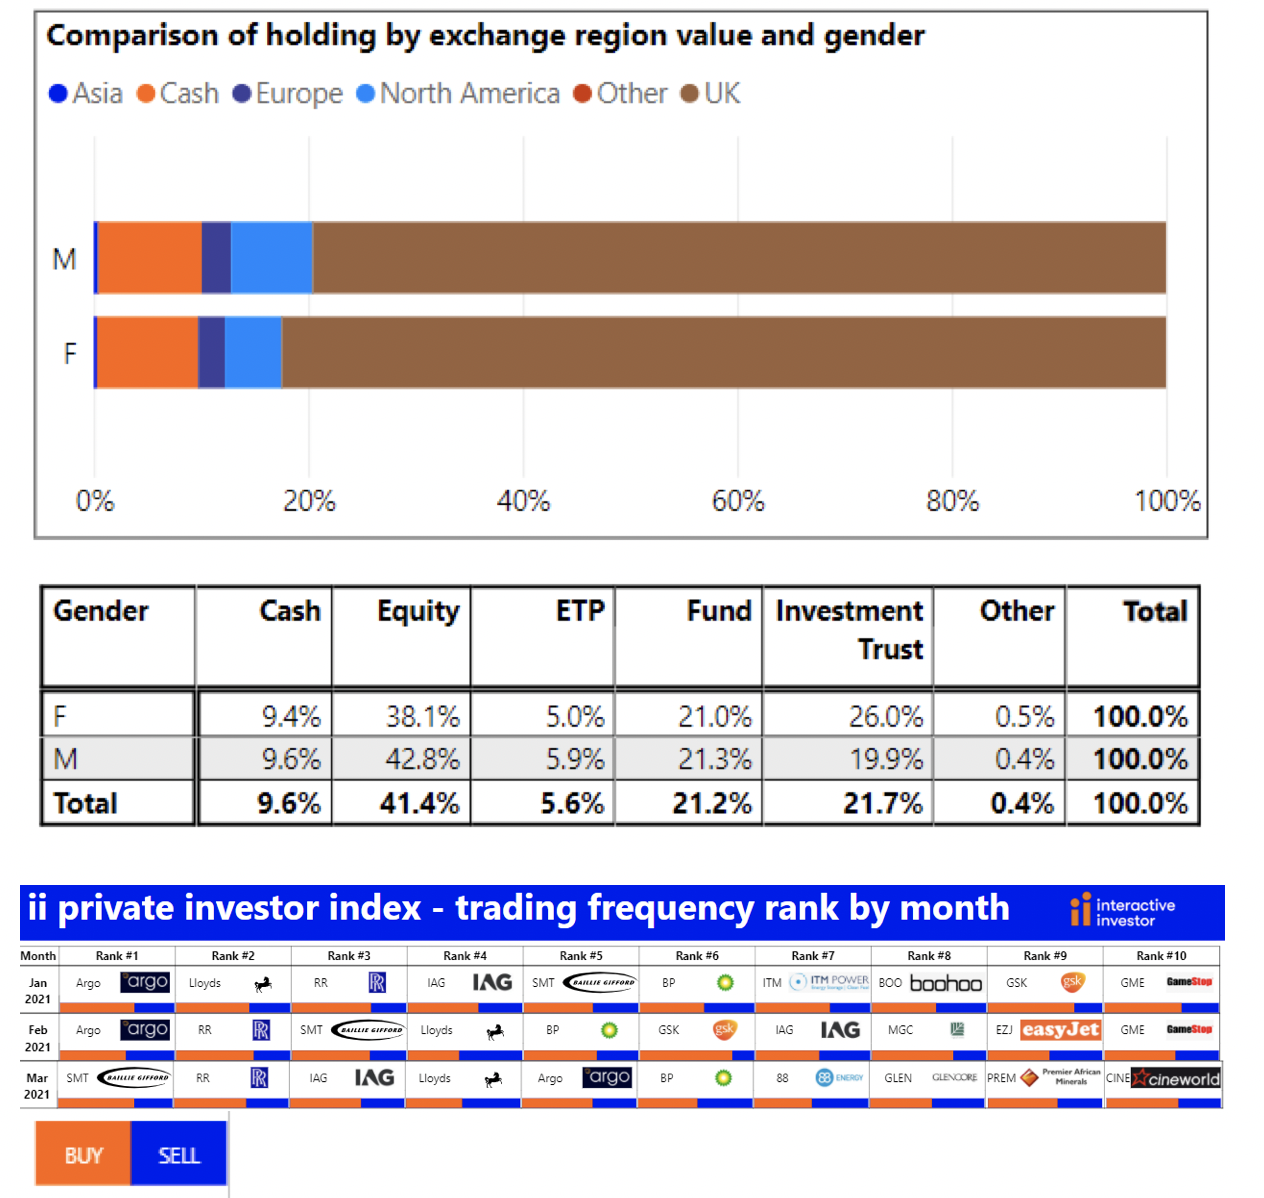
Gender
Women were slightly behind men in quarter one 2021 in performance terms, up 2.71% versus 3.07% for men. Over the past year to end March 2021, men are up 32.82% versus 30.46% for women. Over the past 15 months, the average female interactive investor customer is up 4.05% versus 4.87% for men.
The slight underperformance of women could be due to the fact that on average, when it comes to direct equity exposure, they have higher UK exposure and less North America exposure, during a period where the US has trounced the UK market.
Gender differences – direct equity holdings
Notes to editors
*ii customer performances quoted are median values in order to avoid the influence of outlier performance skewing the data. The performance is calculated using the Time Weighted Rate of Return with returns calculated before each money transaction, then the results compounded over the reporting period. So it is aimed at identifying the performance of the portfolio selections – rather than the timing of funding/withdrawal transactions. Then median averages are calculated independently for each group we analysed – so that outlier performances did not skew the results.
Index performance, unless otherwise stated, is ii using Morningstar.
Portfolio values under £20,000 were stripped out in order to keep the sample representative of ii’s core customer base.
These articles are provided for information purposes only. Occasionally, an opinion about whether to buy or sell a specific investment may be provided by third parties. The content is not intended to be a personal recommendation to buy or sell any financial instrument or product, or to adopt any investment strategy as it is not provided based on an assessment of your investing knowledge and experience, your financial situation or your investment objectives. The value of your investments, and the income derived from them, may go down as well as up. You may not get back all the money that you invest. The investments referred to in this article may not be suitable for all investors, and if in doubt, an investor should seek advice from a qualified investment adviser.
Full performance can be found on the company or index summary page on the interactive investor website. Simply click on the company's or index name highlighted in the article.