Stockwatch: An AIM share to buy on the dips
Amid bold targets to quadruple profit over four years, our analyst shares his view on this company.
12th April 2019 10:31
by Edmond Jackson from interactive investor
Amid bold targets to quadruple profit over four years, our analyst shares his view on this company.

Does political uncertainty play into the hands of this public opinion and data analytics group?
Manufacturing and services are generally exasperated by Brexit, yet polling should remain busy and the growth of online marketing demands regular testing of consumer opinion.
Indeed, the board of £500 million AIM-listed YouGov (LSE:YOU) has declared ambitious targets through to its July 2023 year-end - effectively to quadruple profit – linked to equity bonuses. Aiming for a compound annual earnings per share (EPS) growth rate over 30% also implies confidence.
I've previously been wary of the extent YouGov capitalises various operating expenses as intangibles, meaning a hefty amortisation charge, hence a contrast between statutory and "adjusted" profit/earnings figures. Long-term incentive plan - LTIP - equity bonuses can also make for a frustrating culture where executives lock in gains by selling stock, then having equity exposure replenished by bonuses, such that they don't face risk/reward in the same way as long-term shareholders.
Yet the business is humming, and the recent one-year chart has a resilient growth profile shrugging off last autumn's market debacle. Well-diversified internationally, YouGov merits attention as a business to thrive in politically uncertain times.
Interim results affirm strong overall momentum
Revenue growth for the six months to end-January 2019 rose from 10% to 18% like-for-like, inclusive of acquisitions and currency movements, or by 10% on an underlying basis. The data products and services side is the chief driver of growth, doing notably well: revenue up in mid-thirties per cent levels like-for-like, or by 26% underlying for products and 9% for services - to £37.2 million overall which represents 54% of group total. Custom research edged up 4% to £30.4 million, although operating profit advanced 15% to £7.9 million.
Operating margins have improved for data products and custom research, and, while slipping in data services, they are expected to recover in the second half-year.
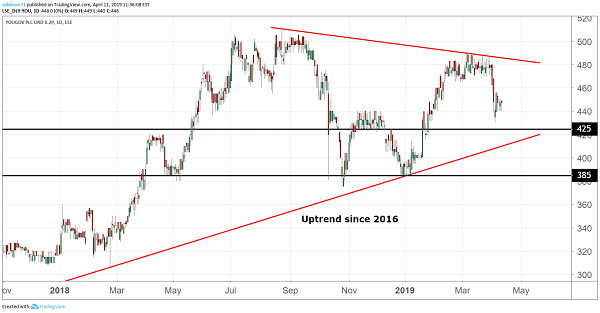
Source: TradingView Past performance is not a guide to future performance
By region, the US is the largest contributor with operating profit up 15% to £9.1 million on YouGov's "adjusted" basis; then the UK with £6.7 million, Europe and the Middle East each around £2 million.
Overall adjusted pre-tax profit is up 41% to £12.5 million, with underlying business growth (ex-acquisitions and currency movements) up 35%, and current trading remains strong, such that if YouGov repeats a second half-year weighting then I estimate annual EPS near 22p (versus the 18p in the table, which could be an old forecast).
If you accept this view of earnings, then a 33% underlying growth rate compares with a price/earnings (PE) multiple of about 21 times, as if the price/earnings-to-growth ratio (PEG is a benchmark for growth stocks) is a very attractive 0.6 times.
Yet after a few pence mark-up in reaction to these results, the stock has slid (albeit on light volume) to about 450p, as if the market isn’t respecting this adjusted view. In fairness this is only a snapshot in recent years' chart context of firm growth from around 100p in mid-2005 up to several tests of 500p last summer before the market debacle.
Overall, it’s a robust chart and light volumes on a results day may likewise reflect content shareholders.
| YouGov - financial summary | Estimates | ||||||
|---|---|---|---|---|---|---|---|
| year ended 31 Jul | 2013 | 2014 | 2015 | 2016 | 2017 | 2018 | 2019 |
| Turnover (£ million) | 62.6 | 67.4 | 76.1 | 88.2 | 107 | 117 | |
| IFRS3 pre-tax profit (£m) | 1.5 | 0.7 | 2.7 | 5.5 | 7.9 | 11.8 | |
| Normalised pre-tax profit (£m) | 2.7 | 3.2 | 3.8 | 6.6 | 8.4 | 15.3 | |
| Operating margin (%) | 4.6 | 4.8 | 5.0 | 7.6 | 7.8 | 10.1 | |
| IFRS3 earnings/share (p) | 2.0 | 0.4 | 3.1 | 3.2 | 4.2 | 7.7 | |
| Normalised earnings/share (p) | 3.3 | 2.8 | 4.2 | 4.3 | 4.7 | 18.0 | |
| Earnings per share growth (%) | 120 | -14.2 | 49.8 | 3.1 | 8.6 | ||
| Price/earnings multiple (x) | 25.0 | ||||||
| Annual average historic P/E (x) | 33.0 | 40.9 | 60.9 | 61.5 | |||
| Cash flow/share (p) | 6.8 | 8.8 | 9.5 | 11.4 | 15.6 | ||
| Capex/share (p) | 4.2 | 5.9 | 5.7 | 5.9 | 7.4 | ||
| Dividend per share (p) | 0.5 | 0.6 | 0.8 | 1.0 | 2.0 | 3.0 | |
| Yield (%) | 0.7 | ||||||
| Covered by earnings (x) | 7.0 | 5.0 | 5.4 | 4.4 | 3.5 | ||
| Net tangible assets per share (p) | 13.4 | 11.4 | 15.0 | 20.1 | 24.2 | ||
| Source: Company REFS |
Questions in the focus on earnings valuation
Perception naturally focuses on earnings and cash flow given net tangible asset of just 13p a share and a sub 1% dividend yield – a typical growth stock profile.
Unfortunately, this can tempt some companies to want to present EPS in the best light. At YouGov there's quite substantial capitalisation of costs as intangible assets: lately £16.5 million, up from £10.9 million in January 2018, alongside £62.5 million goodwill which is up from £42.2 million.
Note 10 to the interim results shows intangible asset's carrying amounts of £5.1 million regarding YouGov's consumer panel, £8.9 million for software development and £2.6 million for customer contracts/lists.
Note 4 (segmental analysis) shows a £4.1 million amortisation charge as relating to these intangible assets rather than goodwill. This can be uncomfortable to investors because genuine costs are involved here, than goodwill amortisation which is a non-cash item. It means a hefty difference between "adjusted" interim EPS of 9.6p versus statutory of 5.4p where an annual outcome say around 13p implies a prospective PE over 35 times – thus a muted response by investors with fresh money, to the results.
When will the penny drop among company directors and their city advisers, such numbers' malarkey does little except sow confusion and suspicion? Adjustments proclaim pre-tax profit 65% above statutory levels, hard to swallow.
Not to lose sight about how YouGov has attractive growth dynamics: even on a statutory basis, operating profit is up 92% to £8.4 million and pre-tax profit by 85% to £8.3 million pre-tax.
Meanwhile, the cash flow statement shows a mixed list of adjustments to pre-tax profit such that cash generated from operations is not so different: £8.6 million, up 15% on the six months to January 2018.
Company REFS doesn't share YouGov's sense of normalised profit. Its entry for 2018 is missing – presumably the table hasn't been updated, so I've entered other figures – but for 2017 it cites £8.4 million versus YouGov proclaiming £16.4 million and the statutory figure of £7.9 million.
Some decent shareholdings and insider trading
One way to cut through any confusion is look at the pattern of insider ownership and share trading. CEO Stefan Shakespeare owns 7.1% of the business, although as a co-founder he benefited from being in-on-the-ground-floor; otherwise director stakes are moderate; e.g. the chief operating officer owning a meaningful 336,008 shares but the chief financial officer a modest 8,978.
In recent months there's been a couple of 'PDMR' sales – i.e. senior managers. Last February the chief innovation officer sold 22,500 shares at 459p and last November the global head of custom research sold 10,000 shares at 430p.
Unlike for directors, no details seem to be required about ongoing PDMR holdings; did they sell out? An apologist stance would be that these are relatively younger people with the demands of families and mortgages; and if they have earned such stakes e.g. via share bonus awards, then why should they not enjoy that? The problem being that alongside dubious "adjusted" figures, it looks as if those conscious to protect what value they have, prefer it in cash.
'Buy the dips' is a fair conclusion
YouGov's growth trajectory merits attention, if needing a caution about its presentation. Yet this is no secret, it has existed for years during which time the stock has shown a firm growth trend. And, on the basis of management's confident targeting, a case could be made that YouGov can grow into even a demanding multiple of statutory earnings. Buy on weakness.
Edmond Jackson is a freelance contributor and not a direct employee of interactive investor.
These articles are provided for information purposes only. Occasionally, an opinion about whether to buy or sell a specific investment may be provided by third parties. The content is not intended to be a personal recommendation to buy or sell any financial instrument or product, or to adopt any investment strategy as it is not provided based on an assessment of your investing knowledge and experience, your financial situation or your investment objectives. The value of your investments, and the income derived from them, may go down as well as up. You may not get back all the money that you invest. The investments referred to in this article may not be suitable for all investors, and if in doubt, an investor should seek advice from a qualified investment adviser.
Full performance can be found on the company or index summary page on the interactive investor website. Simply click on the company's or index name highlighted in the article.
Disclosure
We use a combination of fundamental and technical analysis in forming our view as to the valuation and prospects of an investment. Where relevant we have set out those particular matters we think are important in the above article, but further detail can be found here.
Please note that our article on this investment should not be considered to be a regular publication.
Details of all recommendations issued by ii during the previous 12-month period can be found here.
ii adheres to a strict code of conduct. Contributors may hold shares or have other interests in companies included in these portfolios, which could create a conflict of interests. Contributors intending to write about any financial instruments in which they have an interest are required to disclose such interest to ii and in the article itself. ii will at all times consider whether such interest impairs the objectivity of the recommendation.
In addition, individuals involved in the production of investment articles are subject to a personal account dealing restriction, which prevents them from placing a transaction in the specified instrument(s) for a period before and for five working days after such publication. This is to avoid personal interests conflicting with the interests of the recipients of those investment articles.