Stockwatch: Profit from China's wealthy middle class
It's a leader in its field, and our stock picker thinks impressive results make this class act a buy.
15th February 2019 09:03
by Edmond Jackson from interactive investor
It's a leader in its field, and our stock picker thinks impressive results make this class act a buy.

Two-thirds of US companies have reported fourth-quarter 2018 results amid questions about whether the bull market is resurging, or if this is a snapback rally in a bear market.
Analysis by Factset shows 71% of companies have reported a positive earnings surprise and 62% a positive revenue surprise. The blended earnings growth rate for S&P 500 companies was 13.3%, marking a fifth straight quarter of double-digit earnings growth. Expectations as of 31 December had been for 12.1%, so there's a slight beat if driven by a modest six sectors.
Within such figures, however, US firms with over 50% of revenues in the US showed 16.6% blended earnings growth versus 8.4% for those with 50% of sales outside the US. This could be interpreted as the US benefiting from Trump's tax cuts while the rest of the world succumbs to trade tensions.
US earnings expectations may have further to fall
Recent progress has been good then, but it's on prospects where the view changes and gets worse.
While the consensus for Q1 2019 earnings growth had been for +3.2% as of 31 December, Factset reckons it has now dropped twice, to -0.8% then -1.7%. Morgan Stanley's chief equity strategist – heralded the most accurate last year – has cut his earnings growth forecast on S&P 500 firms from 4.3% to just 1%, based on their downgraded guidance, and regards market optimism for a rebound later this year is misplaced: earnings could end 2019 down 3.5% overall.
"Downward revisions have come faster and steeper than we expected... At the start of a downward revisions cycle, history tells us not to count on that kind of upwards inflection (later this year). Equity returns can still be positive in this environment, but they will likely be weaker than they otherwise would have been."
Cisco and Hilton as picks of the crop
In which context I'm interested to see which US companies are performing and guiding robustly. Latest attention is on Cisco Systems (NASDAQ:CSCO) beating revenue and earnings expectations for calendar Q4 (its fiscal Q2) and estimating 2019 revenue growth of 4-6% versus consensus for 3%.
Coming from a global technology behemoth, perhaps technology replacement can mitigate risks with the business cycle more generally? Mind some false price/earnings (PE) multiples quoted for Cisco – anything from 140 to 180 times but which relate to a one-off tax bill for repatriation of earnings. On a normalised basis it's more like 19 times, up from 15 in the middle of last year. For a near $215 billion company, that could be said fair enough intrinsically: "elephants don't gallop".
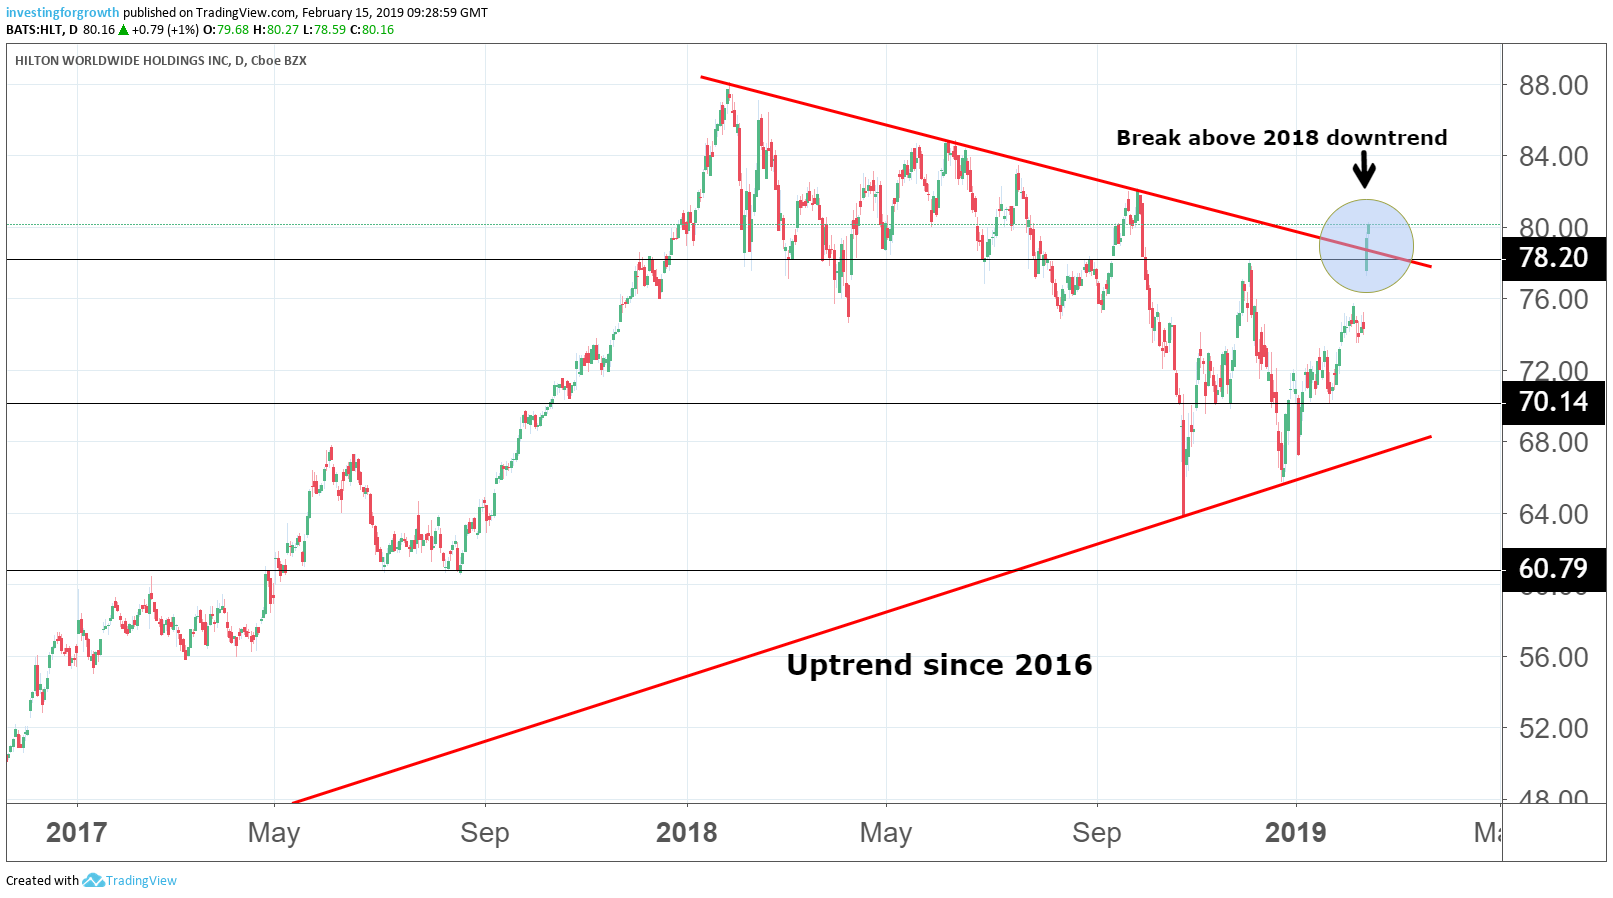
Hilton Worldwide Holdings (NYSE:HLT), a $23.5 billion hotels/resorts group, has also beaten expectations, and its stock is up almost 7% to $79.37 in response.
I take note because its portfolio - that increasingly prioritises development of mid-range hotels - could be seen as sensitive to changes in consumer confidence and business activity, more so than those enjoying wealthier patrons, or budget hotels able to benefit from customers trading down quite like "value retailers".
Hilton hotels are favoured by business executives/reps for marketing trips and the like, so, if global growth is indeed stalling, then we'd expect to hear "challenged" talk from Hilton, yet its prognosis is quite bullish, hence its share price rise.
Strong advances in key financial measures
Without substantial tax credits distorting net profit and earnings per share (EPS) comparisons (see table), Hilton's revenue and operating profit advances are impressive – up 9.5% and 26.5% respectively.
Within these numbers, revenue per available room or "RevPAR" - the average daily room rate divided by its occupancy rate – grew at rates of 2.6% to 4%, or 3% overall. This key performance metric for hotels was better in Europe, up 7.2% in Q4, benefiting from increased US travel to London amid weaker sterling.
Corporate and leisure bookings softened in Q4, however, and 2019 bookings are up mid-single-digits; anticipated RevPAR of 1% to 3% for 2019 assumes the help of price increases (corporate rates up just over 2%). Hilton continues to be somewhat rescued by strong "net unit growth", where 2018 saw 450 extra hotels or 7% annual growth, and was Hilton's best year for construction starts on new rooms. This ought therefore to support the overall 2019 scenario.
Why is the stock up as much as nearly 7% though? A big move for a $23.5 billion company, given its PE ratio is about 17 times and the prospective yield a negligible 0.6%. I believe it reflects recognition of Hilton's global development for the long term: 30% of the hotel development pipeline is located in Asia Pacific, thus benefiting from China's growing middle class. Europe, the Middle East and Africa represent 20% of the pipeline; and Hilton says it is opening hotels in the US "at the fastest rate in the industry's history".
A recent fear has been that higher US interest rates and tariffs against China would disrupt global growth generally, but the Federal Reserve has appeared to shift stance as if its interest rate rises are done, and trade talks seemingly evolve. So sentiment is shifting back to stocks representing a play on the global economy, well-run hotels being a prime example.
Source: TradingView (*) Past performance is not a guide to future performance
China leads group development, justifiably
Hilton's development is currently at the mid-level rather than high-end, especially the "Hampton by Hilton" brand where the 50th such hotel in China has been opened with 200 more planned.
The CEO summarises: "The middle class is growing, they want to travel and that's what they can afford." Rooms' growth in China rose near 50% last year and he's confident of another 30-33% this year given only 12-18 months for construction. (This is in context of about 20% net unit growth targeted this year for Asia Pacific as a whole.)
"I think we'll do more conversions this year in China than we've ever done...we're feeling very good about the next couple of years here."
I'd mind risks to Chinese consumer confidence amid fears about the impact of the US trade war on jobs and incomes, and how pressure on personal spending could grow in 2019. But if financial markets are correct to anticipate progress in the trade talks, averting further tariffs, this would be bullish for Hilton.
Chinese asset deflation – such as a 25% slump in the Shanghai stock market last year, and housing hit by government restrictions aimed at curbing speculation and price growth – could also hurt the middle classes' spending power; property being the most popular investment for consumers.
Yet the government is said to be looking at tax cuts and fiscal spending in support of consumption, where the growth rate is "slowing", down to 8.4% in context of GDP growth of 6-6.5%. Thus, in relative global context, Hilton's expansion in China is logical and a long-term driver.
Debt looks manageable to achieve such goals
At end-2018, Hilton had $7.4 billion long-term debt at an average interest rate around 4.5%, and the income statement (see table) shows this clipped nearly 25% off operating profit. So the recent change in declared US interest rate policy also helped expectations as to this cost, hence the stock is up from $66.5 on 17 December, a 20% rise beating the market.
Strictly, you'd be better off with a tactic to buy future dips, if the US market capitulates to a sense of earnings recession, and especially if trade talks disappoint. But, given progress to avert further tariffs on China, Hilton is likely to sustain its rally from about $79 currently. Accumulate.
| Hilton Worldwide Holdings Inc | ||||||
|---|---|---|---|---|---|---|
| consolidated statement of operations | ||||||
| $ millions | Three months ended 31-Dec | % change | Year ended 31-Dec | % change | ||
| Revenues | 2018 | 2017 | 2018 | 2017 | ||
| Fee-based, total | 943 | 874 | 7.9% | 3,668 | 3,404 | 7.8% |
| From managed/franchised | 1,345 | 1,194 | 12.6% | 5,238 | 4,727 | 10.8% |
| properties | ||||||
| Total revenues | 2,288 | 2,068 | 10.60% | 8,906 | 8,131 | 9.5% |
| Total expenses | 1,926 | 1,809 | 6.50% | 7,474 | 6,999 | 6.8% |
| Operating profit | 362 | 259 | 39.8% | 1,432 | 1,132 | 26.5% |
| Net interest charge | -96 | -78 | -354 | -379 | ||
| Pre-tax profit | 266 | 181 | 47.0% | 1,078 | 753 | 43.2% |
| Tax expense/benefit | -41 | 549 | -309 | 336 | ||
| Net Profit | 225 | 730 | -69.2% | 769 | 1,089 | -29.4% |
| Earnings per share - diluted | 0.75 | 2.27 | -67.0% | 2.50 | 3.32 | -24.7% |
| Dividends per share | 0.15 | 0.15 | 0% | 0.60 | 0.60 | 0% |
*Horizontal lines on charts represent levels of previous technical support and resistance. Trendlines are marked in red.
Edmond Jackson is a freelance contributor and not a direct employee of interactive investor.
These articles are provided for information purposes only. Occasionally, an opinion about whether to buy or sell a specific investment may be provided by third parties. The content is not intended to be a personal recommendation to buy or sell any financial instrument or product, or to adopt any investment strategy as it is not provided based on an assessment of your investing knowledge and experience, your financial situation or your investment objectives. The value of your investments, and the income derived from them, may go down as well as up. You may not get back all the money that you invest. The investments referred to in this article may not be suitable for all investors, and if in doubt, an investor should seek advice from a qualified investment adviser.
Full performance can be found on the company or index summary page on the interactive investor website. Simply click on the company's or index name highlighted in the article.
Disclosure
We use a combination of fundamental and technical analysis in forming our view as to the valuation and prospects of an investment. Where relevant we have set out those particular matters we think are important in the above article, but further detail can be found here.
Please note that our article on this investment should not be considered to be a regular publication.
Details of all recommendations issued by ii during the previous 12-month period can be found here.
ii adheres to a strict code of conduct. Contributors may hold shares or have other interests in companies included in these portfolios, which could create a conflict of interests. Contributors intending to write about any financial instruments in which they have an interest are required to disclose such interest to ii and in the article itself. ii will at all times consider whether such interest impairs the objectivity of the recommendation.
In addition, individuals involved in the production of investment articles are subject to a personal account dealing restriction, which prevents them from placing a transaction in the specified instrument(s) for a period before and for five working days after such publication. This is to avoid personal interests conflicting with the interests of the recipients of those investment articles.