Stockwatch: A quality AIM share throwing off cash
Final results underline strength in this firm's business model, and current forecasts look conservative.
19th March 2019 09:50
by Edmond Jackson from interactive investor
Final results underline strength in this firm's business model, and current forecasts look conservative.

Do 2018 results from AIM-listed investment manager Miton Group (LSE:MGR) reinforce the case for its stock which has dropped from an all-time high of 76p last autumn?
I've favoured Miton as a 'buy' or 'hold' since January 2015 at 25p and, despite falling to 21p mid-2016, its chart and underlying progress have been strong, reaching 76p mid-2018 - where I suggested 'take profits' - albeit down to a 40p range in the late 2018 sell-off.
The group has just declared adjusted pre-tax profit up 34% to £9.2 million and earnings per share (EPS) up 45% to 4.5p, beating expectations by at least 30% and showing the aspect of operational gearing in smaller fund managers (a chief reason I've drawn attention) as the asset base expands on a relatively fixed cost base (so long as management doesn’t get greedy for pay/bonuses).
Adjusted versus headline figures don't vary much, and an operating margin around 25% reflects a quality operation. Miton's long-term record (see table) shows negligible capital expenditure versus strong cash flow, conducive to dividends/buybacks unless stock markets went into a chronic downturn.
The stock is up about 12% to 58p, representing a price/earnings (PE) multiple in the low teens on these results, possibly 11 on a forward basis, yielding around 4% - additionally with buybacks enhancing value – due to strong cash flow versus low investment needs.
Such a rating reflects a sense of how a cyclically-adjusted view of earnings/ratings is more appropriate after a 10-year equities bull-run – i.e. the probability is, they all head lower.
But, unless stock markets destabilise and impact fees linked to fund valuations, also buy/redeem behaviour among fund-holders, the forecast for £7.1 million pre-tax profit this year (as was predicted for 2018) certainly needs upgrading, and EPS of 5.3p is conservative. There's no debt to slow a reasonably benign investment environment aiding the bottom line.
Bumper asset growth yet still a long-term growth context
From Miton's headlines it's easy to fret, representing the culmination of a 10-year bull market fuelled by central banks expanding balance sheets (currently more like contracting) and a buoyant global economy (now in doubt).
As at end-2018, assets under management were up 14% to £4,376 million, helped by a 106% rise in net inflows to £1,019 million. However, current trading cites neutral net flows for the year to date, which sceptics would say marks a consolidation. I would factor in Brexit influencing people to sit on hands regarding anything beyond a short-term commitment.
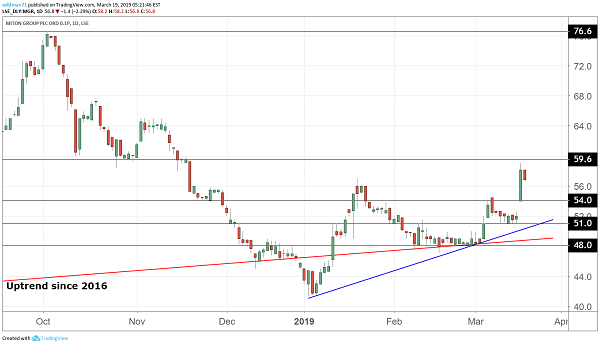
Source: TradingView (*) Past performance is not a guide to future performance
The equity fund range has expanded 27% to £3,015 million and, while this ties investor perception of Miton to confidence in equities generally, it diversifies from a legacy risk – of Miton's origins in UK small cap stock-picking.
While there appears some modest decline in the funds stable's reputation – down from 87%/86% rated first or second quartile in 2017/2016, to 81% - it's not yet enough to tip fund-holder/buyer sentiment away from Miton, relative to the chief risk of equity exposure per se.
Thus, I continue to see this stock being an attractive long-term play on the attractive economics of an asset management business developing. There are going to be periods when stock markets turn down but, unless this happens severely, Miton looks to have achieved quite a critical mass.
See from the historic table how turnover bumped along sideways around £28 million, including dips, with pre-tax profit near £7 million – albeit dropping significantly lower at times. There's a fair chance, expansion has helped the business break out this range, given a base of net management fees up 26% to £27.5 million.
| Miton Group - financial summary | |||||||
|---|---|---|---|---|---|---|---|
| year ended 31 Dec | Estimates | ||||||
| 2013 | 2014 | 2015 | 2016 | 2017 | 2018 | 2019 | |
| Turnover (£ million) | 28.0 | 27.0 | 22.0 | 24.1 | 27.8 | 36.2 | |
| IFRS3 pre-tax profit (£m) | 0.7 | -5.5 | 2.1 | 4.3 | 6.2 | 8.9 | |
| Normalised pre-tax profit (£m) | 1.8 | 6.8 | 2.5 | 4.9 | 6.8 | 9.2 | 7.1 |
| Operating margin (%) | 6.1 | 24.9 | 11.0 | 20.1 | 24.4 | 25.4 | |
| IFRS3 earnings/share (p) | 1.1 | 4.6 | 0.9 | 2.3 | 3.1 | 4.5 | 5.3 |
| Earnings per share growth (%) | 82.0 | 318 | -80.0 | 156 | 34.8 | 45.2 | 23.3 |
| Price/earnings multiple (x) | 12.9 | 10.9 | |||||
| Historic annual average P/E (x) | 37.2 | 5.5 | 29.4 | 16.8 | 16.2 | 11.3 | |
| Cash flow/share (p) | 3.1 | 2.0 | 0.7 | 5.6 | 3.9 | ||
| Capex/share (p) | 0.2 | 0.1 | 0.0 | 0.0 | 0.0 | ||
| Dividend per share (p) | 0.45 | 0.54 | 0.60 | 0.67 | 1.4 | 2.0 | 2.4 |
| Dividend yield (%) | 3.4 | 4.1 | |||||
| Covered by earnings (x) | 2.6 | 9.5 | 1.9 | 3.8 | 2.2 | 2.3 | 2.2 |
| Net tangible assets per share (p) | 1.8 | 8.3 | 9.4 | 11.1 | 10.3 | 11.9 |
Source: Company REFS Past performance is not a guide to future performance
Success hasn't turned management greedy
A potential risk of investing in smaller agency type businesses is their retaining the culture of a private partnership on matters like remuneration, while capitalising on the public benefits of a listing.
However, Miton's latest income statement shows share-based payment expenses relatively modest, down 45% to £303,000 in context of £8.8 million operating profit, while administrative expenses as a percentage of revenue have edged down from 52% to 50%.
A problem arises if wages and/or benefits soar during prosperous years, creaming off the upside of an operationally geared business to its insiders, with outside shareholders absorbing relatively more pain when performance falls in tougher times. Yet it appears Miton is paying its people what's needed competitively, not a lot more, hence attractions of owning its equity.
Business model is now throwing off cash
A 2p per share dividend is proposed, re-rating the payout and substantiating Miton's credentials as "investment grade". Earnings cover is being maintained at around 2.2 times, a sensible balance respecting the inherent risk of earnings variability when a business relates partly to stock market values/sentiment, yet also a set-up that once established can liberally generate and return cash.
Miton's 2018 cash flow statement shows net cash generated from operations up 69% to £12.4 million while in terms of outflows, the business needed only £172,000 spent on property and equipment, enabling £2.7 million to be spent buying back shares – additional to £2.2 million paid out as dividends.
This looks a very sensible policy for returns as buybacks can be cut more easily – in terms of their impact on perception – than dividends, should earnings vary. While buybacks attract criticism for boosting EPS to trigger management bonus schemes, Miton still has some 157 million shares issued (recently down from 173 million) thus buybacks can improve its valuation benchmarks.
As a "people business" this stock's asset value is its human talent, and only a bear market would result in pricing for a high yield, so it makes sense to preen EPS.
Miton exemplifies wider perception/sentiment shifts
A cautious view of a stock like this is that equities being at a watershed after a 10-year bull market amid signs the global economy has run out of steam. Central bankers have also done little to normalise interest rates, limiting their ability to create a stimulus effect with future cuts come the next recession. Buying/holding this stock implies you think odds are more favourable.
Technically, Miton exemplifies the challenge to decipher if the wider market retreat in late 2018 was back to a longer-term uptrend – like its chart currently appears to suggest – or marked a classic "blow-off" during 2018, of higher-risk/reward assets.
On a bearish view, traders established a definitive turning point as they embraced, then shunned risk. It's unclear whether this marks a period of separation with risk steadily returning to favour, or the late 2018 small cap plunge reflecting something more like divorce.
Small and big caps are prone to exchange the baton as market leaders: during 2019 there has been a positive sentiment shift in major banks/insurers, likely explained by liquidity. If data suggests a false rebound, they can more easily be dumped.
The exit from small caps in late 2018 can thus also be seen as investors expressing a liquidity preference lest the bull market gives way to uncertainty. Not that small caps have been written off, more like they are in a "pending" category while investors are cautious how it may only take a few disappointments in the macro context to bring markets down again.
But say if Brexit is managed through and a reasonably respectable US/China trade deal emerges, risk appetite will more likely rise.
Overall, and unless disaster prevails, I think Miton's attractive size – well-established to capitalise on fund management economics, yet small enough to grow per share values decently, tip the balance to: Add.
*Horizontal lines on charts represent levels of previous technical support and resistance. Trendlines are marked in red.
Edmond Jackson is a freelance contributor and not a direct employee of interactive investor.
These articles are provided for information purposes only. Occasionally, an opinion about whether to buy or sell a specific investment may be provided by third parties. The content is not intended to be a personal recommendation to buy or sell any financial instrument or product, or to adopt any investment strategy as it is not provided based on an assessment of your investing knowledge and experience, your financial situation or your investment objectives. The value of your investments, and the income derived from them, may go down as well as up. You may not get back all the money that you invest. The investments referred to in this article may not be suitable for all investors, and if in doubt, an investor should seek advice from a qualified investment adviser.
Full performance can be found on the company or index summary page on the interactive investor website. Simply click on the company's or index name highlighted in the article.
Disclosure
We use a combination of fundamental and technical analysis in forming our view as to the valuation and prospects of an investment. Where relevant we have set out those particular matters we think are important in the above article, but further detail can be found here.
Please note that our article on this investment should not be considered to be a regular publication.
Details of all recommendations issued by ii during the previous 12-month period can be found here.
ii adheres to a strict code of conduct. Contributors may hold shares or have other interests in companies included in these portfolios, which could create a conflict of interests. Contributors intending to write about any financial instruments in which they have an interest are required to disclose such interest to ii and in the article itself. ii will at all times consider whether such interest impairs the objectivity of the recommendation.
In addition, individuals involved in the production of investment articles are subject to a personal account dealing restriction, which prevents them from placing a transaction in the specified instrument(s) for a period before and for five working days after such publication. This is to avoid personal interests conflicting with the interests of the recipients of those investment articles.