Stockwatch: should I buy Aston Martin shares, or sell up?
7th March 2023 10:40
by Edmond Jackson from interactive investor
This iconic carmaker has staged a dramatic recovery since the autumn, confirming Edmond Jackson’s optimism. Our columnist explains how he feels about the shares now and what he’d do with them.

Are there times when you might overlook a company’s weak financial record and take faith in its potential and follow its stock chart?
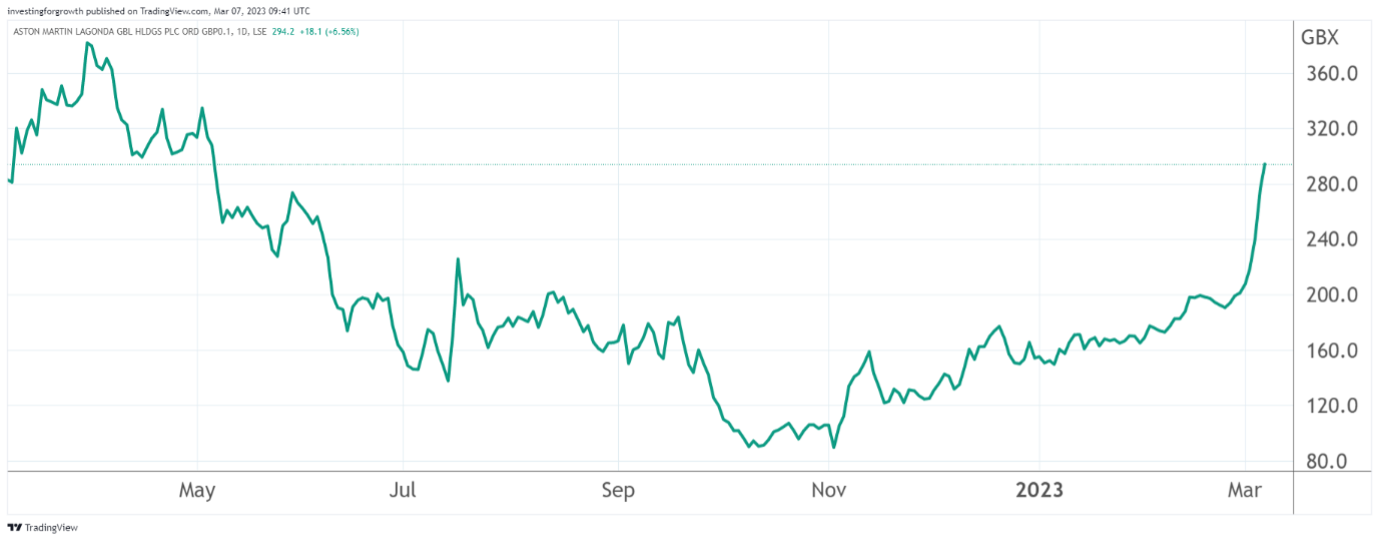
The dilemma is exemplified by luxury car-maker Aston Martin Lagonda Global Holdings (LSE:AML). On 1 March, it declared a near £500 million pre-tax loss for 2022. Yet its stock maintained its mid-February rise, up 10% on 3 March and by 11am yesterday, another 25%.
- Invest with ii: Share Dealing with ii | Open a Stocks & Shares ISA | Our Investment Accounts
Past performance is not a guide to future performance.
True, the results reflected an exceptional factor of adverse foreign exchange and investment in new models and marketing that could pay off longer-term. But Aston shares, adjusted for a share split at the end of 2020, had fallen a remarkable 98% from an equivalent 4,500p soon after listing in October 2018. As a general rule, stocks do not come back after such extent of fall, except by way of “dead cat bounce”.
On 2 March, a non-executive director appointed six months ago, bought £26,300 of shares at 220p. While it is convention for such directors to become shareholders and this one is not short of a bob – having been a longstanding partner of a city law firm – he manifestly believes in long-term upside.
- Insider: bosses spend over £1m on FTSE 100, AIM and Aston Martin
- Shares for the future: why I think these 24 shares are good value
I noticed Aston starting to rise and wondered last weekend if it might pop. Monday provided an excuse - February UK car registrations up a remarkable 26% - although owning Aston shares is really a play on the global super-wealthy.
Traders appear to have latched onto a sense of how the chart’s 200-day moving average implies a target of 360p.
Does it affirm my ‘buy’ call?
Trying not to succumb to confirmation bias, I believe the ‘buy’ case I made last August at 460p - equivalent to 178p in today’s money following the rights issue in September -also explains why Aston equity is twitchy.
A change of top management meant a former CEO of Ferrari moving into this role, and a new chief technical officer had been responsible for creating some of Ferrari’s most iconic models.
Briefly reading across to Ferrari NV (NYSE:RACE), this is a £41 billion equivalent stock on a trailing price/earnings (PE) ratio near 50 times and nearly 10 times revenue. US equity values could be rather exoticy yet here, Aston is valued shy of £2 billion on 1.4 times sales, although admittedly it is loss-making so far.
When you think of cars as status symbols, Aston Martin and Ferrari are peers in terms of global branding. A capable management should be able to leverage Aston at least some way nearer Ferrari.
The Ferrari experience showed only a 5% slip in vehicle shipments over 2009, and sales growth nearly three times European GDP rates in recent years. Reason exists to regard luxury cars as recession-exempt, dialling into demand from the super-rich.
So although Aston equity is still way off “investment grade”, I would normally emphasise that it is possible to weigh the odds and make an imaginative leap here.
Aston Martin Lagonda Global Holdings
Year-end 31 Dec
| 2017 | 2018 | 2019 | 2020 | 2021 | 2022 | |
| Turnover (£ million) | 876 | 1,097 | 981 | 612 | 1,095 | 1,382 |
| Operating margin (%) | 17.0 | 2.4 | -5.3 | -56.6 | -3.9 | -12.0 |
| Operating profit (£m) | 149 | 26.0 | -52.0 | -346 | -42.4 | -166 |
| Net profit (£m) | 76.4 | -62.7 | -126 | -419 | -192 | -529 |
| EPS - reported (p) | 81.3 | -75.8 | -111 | -206 | -68.8 | -124 |
| EPS - normalised (p) | 58.0 | 18.9 | -67 | -130 | -82.0 | -113 |
| Operating cashflow/share (p) | 366 | 269 | 17.0 | -97.9 | 58.9 | 29.9 |
| Capital expenditure/share (p) | 313 | 375 | 271 | 128 | 60.8 | 67.6 |
| Free cashflow/share (p) | 53.0 | -106 | -254 | -226 | -1.9 | -37.6 |
| Return on total capital (%) | 13.5 | 2.1 | -3.9 | -17.4 | -2.2 | -8.1 |
| Cash (£m) | 175 | 145 | 80.1 | 464 | 393 | 592 |
| Net debt (£m) | 684 | 676 | 985 | 724 | 899 | 719 |
| Net assets (£m) | 129 | 424 | 318 | 788 | 642 | 753 |
| Net assets per share (p) | 137 | 454 | 341 | 261 | 210 | 108 |
Source: historic company REFS and company accounts
Revenue growth accelerating but cost constraints
Third-quarter 2022 results cited “very impressive demand across our product range” with year-to-date revenue up 16%. Inflationary pressures and logistics disruption meant a full-year profit warning, however.
For the medium term, Aston said: “we remain on our pathway to achieve £2 billion revenue and circa £500 million adjusted EBITDA by 2024/25.” Mind that net profit would be much lower given high depreciation in the auto industry and interest on some £730 million net debt including leases, as of end-2022.
- Stockwatch: why there’s more upside for this share after 80% rally
- Stockwatch: five guiding principles for stock selection in an ISA
The fourth quarter then showed 26% revenue growth to near £1.4 billion, albeit generating a £142 million operating loss, with a £495 million pre-tax loss swollen by a £156 million (non-cash) foreign exchange revaluation of US dollar-denominated debt after sterling fell against the dollar.
While net cash from operations fell 29% to £127 million, at least it was positive. Yet £287 million capital expenditure on the next generation of sports cars took a chunk out of £654 million net proceeds from the equity issue, which enabled a 39% rise in year-end net cash.
Illustrating how EBITDA as a measure, can spring roses out of financial muck, it rose 38% to £190 million.
Consensus (so far) is for net losses continuing in the next two years: £156 million followed by £41 million in 2024.
Mind a substantial premium to net assets
At end-2022 the balance sheet had £773 million net assets, within which a consistent £1.4 billion intangible assets was offset by £1.3 billion total debt including leases. That implies net assets per share of 111p, hence there is nothing approaching a “margin of safety” here. Asset value primarily consists of the Aston Martin brand, although a conservative investor would say the real proof is what it can earn.
There is also not much safety space between £1.1 billion current assets and £1.2 billion current liabilities, within which trade payables are over 3.5 times trade receivables.
While the stock has strengthened modestly again into a 280p range today, be aware its divergent fundamentals expose it to shifts in sentiment.
Short-selling may have contributed to volatility
I did note last August that my ‘buy’ case could be undermined by short positions (over the 0.5% disclosure level) having crept up to 4.0% of Aston’s issued share capital.
This indeed had risen to over 7.0% by last October but has now reduced below 2.4% - with BlackRock and Gladstone Capital trimming theirs as of 2 March.
Given this buying back of equity came a day after the 2022 results they appeared to shift the short case towards cutting such positions. It might still be early to know if yesterday’s jump part-reflected further short-closing, or short-covering, hence it will be worth watching the data.
On a warier note, do not assume, therefore, that Aston’s chart uptick is altogether a reflection of market confidence in improving fundamentals. It may significantly reflect near-term supply/demand playing out, similar to the lurch down into last autumn.
Effectively underwritten by Mercedes-Benz and Saudi’s wealth fund
This jump appears speculative: possibly a blend of short-covering, with Fear Of Missing Out –FOMO - on the long side. Yet it underlines scope for sentiment to shift positively.
Aston is quite above recession worries; its brand has great potential to leverage globally, with Ferrari showing what can be done; and the company enjoys financial support both from Mercedes-Benz and Saudi Arabia’s sovereign wealth fund.
Such deep-pocketed investors participated in the 335p equity capital-raising last year, and therefore have an incentive to conserve and build on that market value.
Mind, any shift to “risk-off” in global markets could prompt traders sitting on profit to exit.
The company also needs to address debt due for redemption in November 2025: the “going concern” section of the 2022 results cites £950 million equivalent, debt maturing then. Perhaps a refinancing will resolve this, although it’s unclear quite whether lenders might insist on additional equity being raised? Be aware of this material risk.
Despite its speculative tag and the possibility of a near-term pull-back my broad long-term stance remains: Buy.
Edmond Jackson is a freelance contributor and not a direct employee of interactive investor.
These articles are provided for information purposes only. Occasionally, an opinion about whether to buy or sell a specific investment may be provided by third parties. The content is not intended to be a personal recommendation to buy or sell any financial instrument or product, or to adopt any investment strategy as it is not provided based on an assessment of your investing knowledge and experience, your financial situation or your investment objectives. The value of your investments, and the income derived from them, may go down as well as up. You may not get back all the money that you invest. The investments referred to in this article may not be suitable for all investors, and if in doubt, an investor should seek advice from a qualified investment adviser.
Full performance can be found on the company or index summary page on the interactive investor website. Simply click on the company's or index name highlighted in the article.
Disclosure
We use a combination of fundamental and technical analysis in forming our view as to the valuation and prospects of an investment. Where relevant we have set out those particular matters we think are important in the above article, but further detail can be found here.
Please note that our article on this investment should not be considered to be a regular publication.
Details of all recommendations issued by ii during the previous 12-month period can be found here.
ii adheres to a strict code of conduct. Contributors may hold shares or have other interests in companies included in these portfolios, which could create a conflict of interests. Contributors intending to write about any financial instruments in which they have an interest are required to disclose such interest to ii and in the article itself. ii will at all times consider whether such interest impairs the objectivity of the recommendation.
In addition, individuals involved in the production of investment articles are subject to a personal account dealing restriction, which prevents them from placing a transaction in the specified instrument(s) for a period before and for five working days after such publication. This is to avoid personal interests conflicting with the interests of the recipients of those investment articles.