Two valuable lessons for every investor
9th June 2021 12:35
by Richard Hunter from interactive investor
Investors can learn a lot about momentum and dividends from this FTSE 100 chart. Our head of markets discusses the power of both.
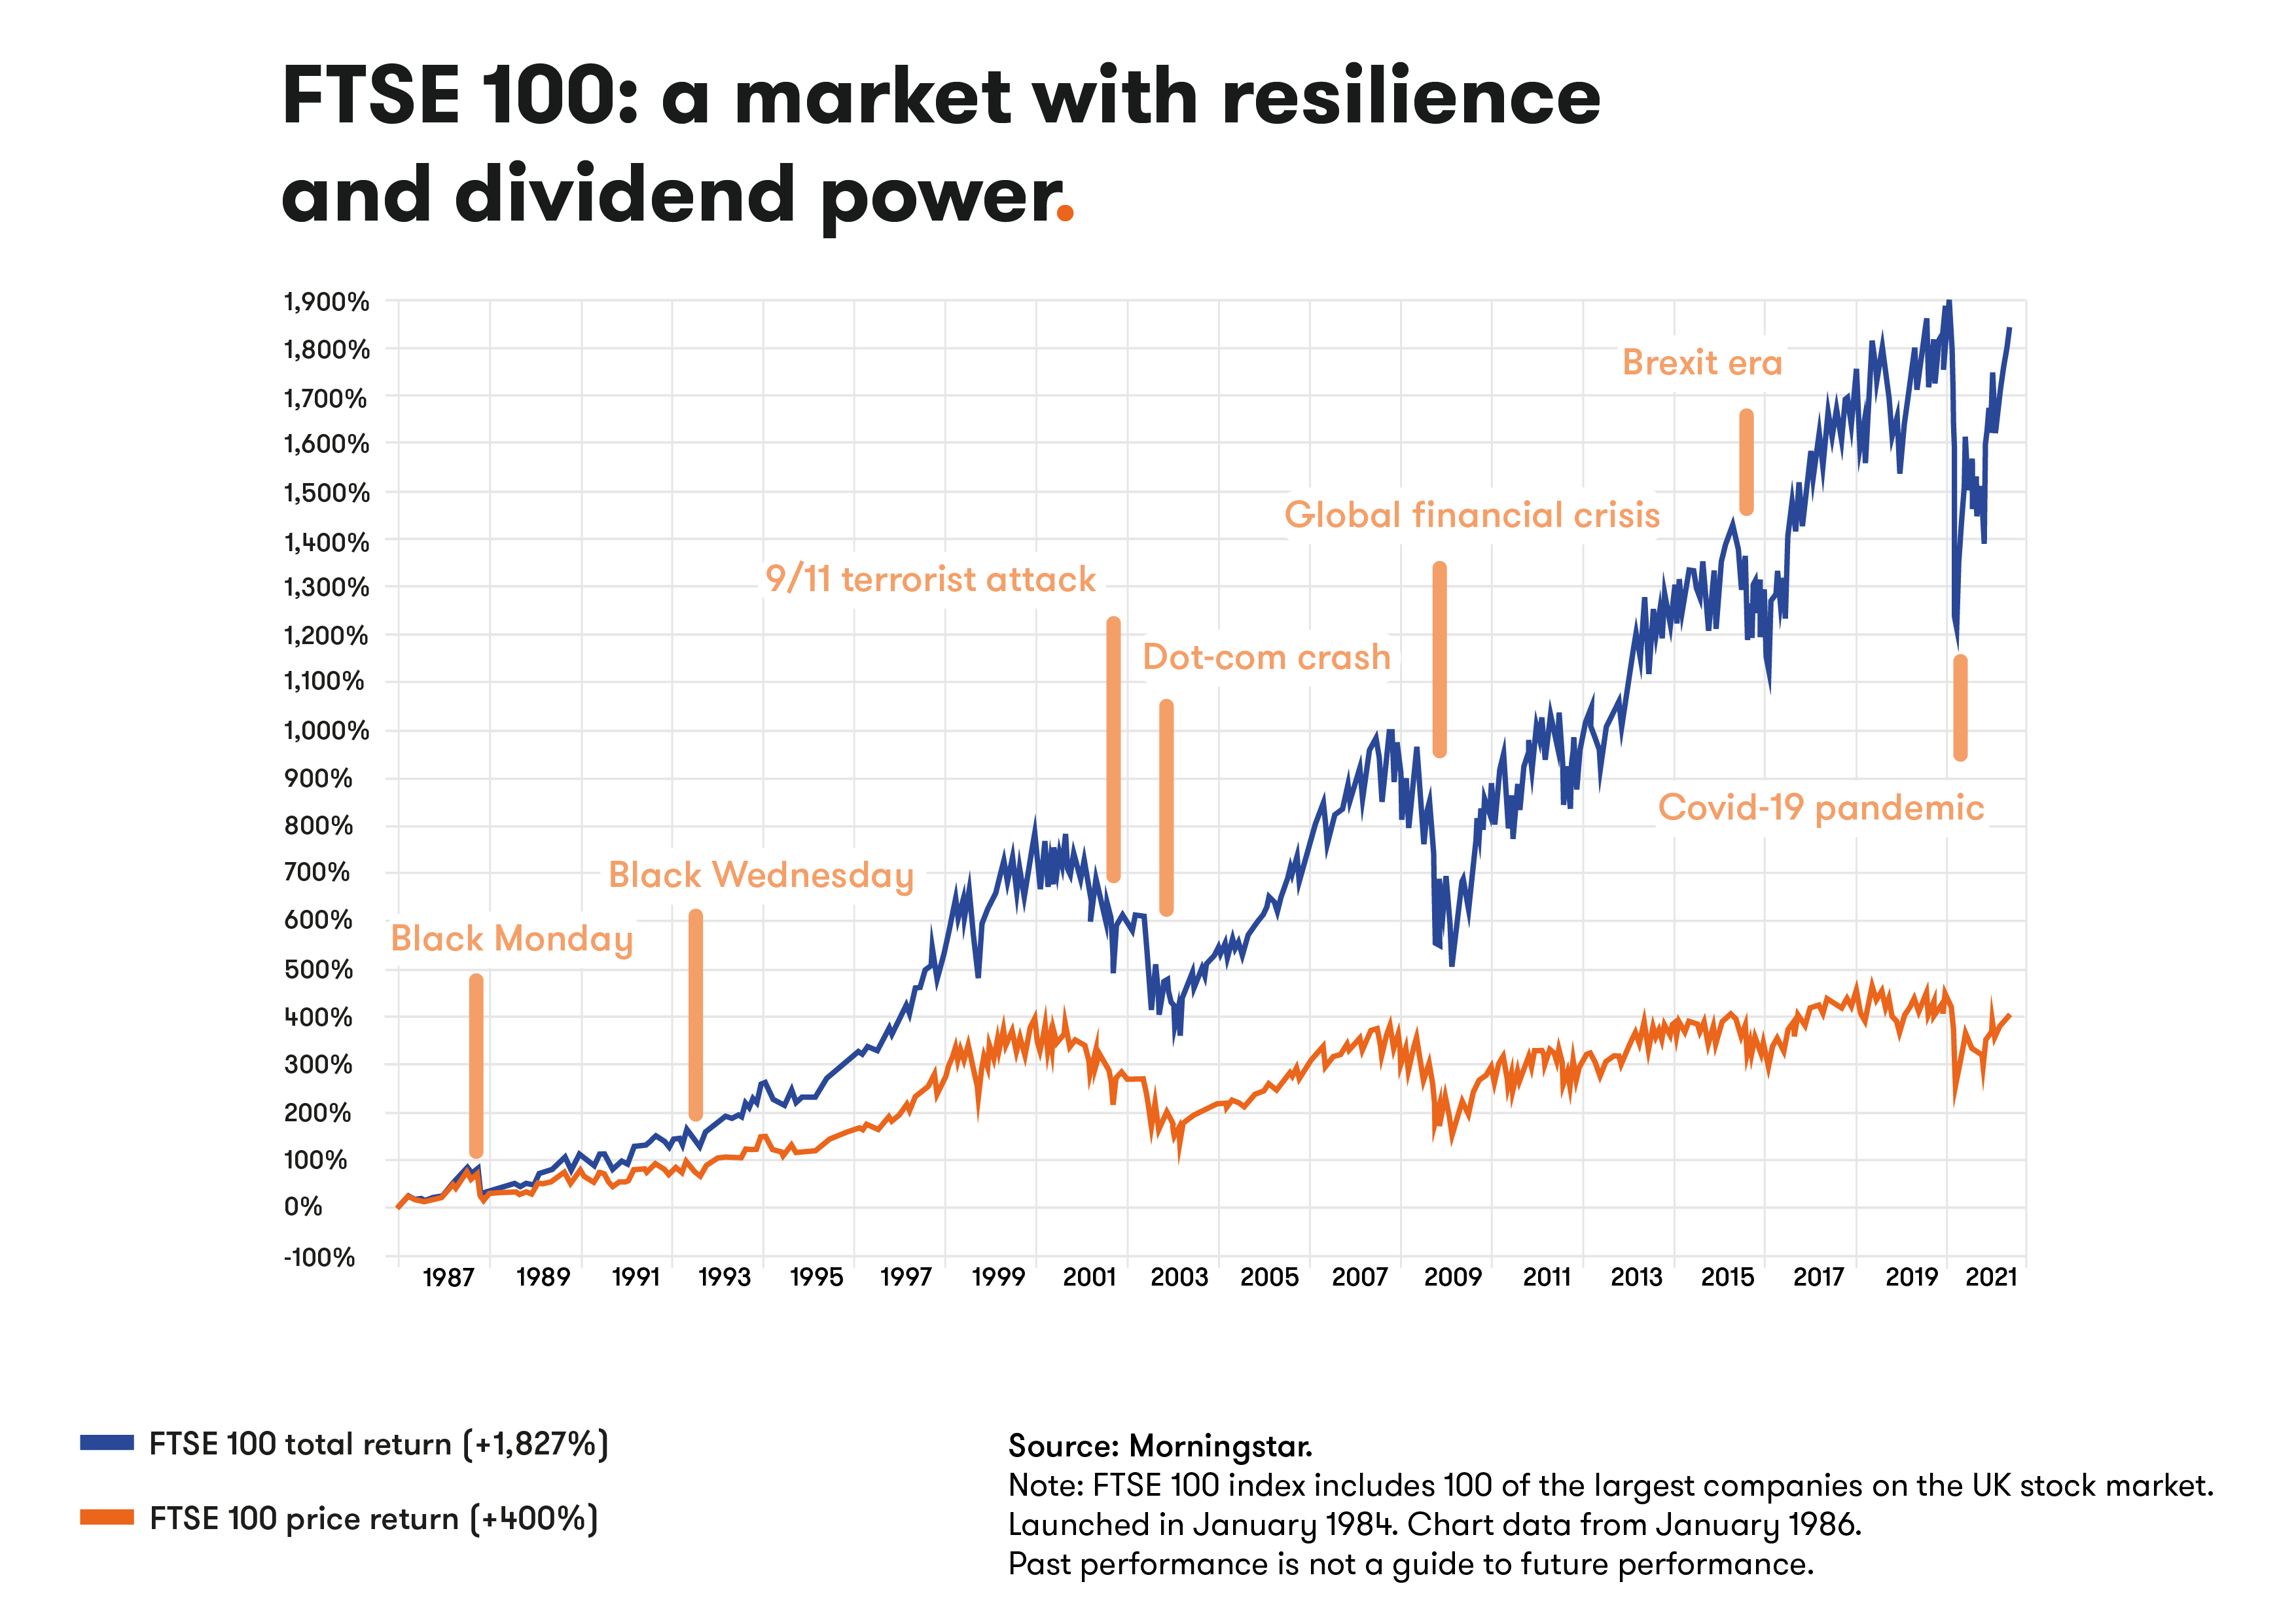
It is said that a picture is worth a thousand words, and the chart below for the FTSE 100 index, which represents 100 of the largest companies on the UK stock market, is a great indication of investment in a nutshell, that it is a long-term commitment.
It is also clear that markets are subject to sharp drops and recoveries due to factors which shape the investment landscape. However, the direction of travel has been positive for decades, and the market has been able to recover from several seismic events.
The crash of 1987, known as “Black Monday”, the dot com boom (and bust) at the turn of the century, the great financial crisis of 2007/2008 and, of course, the recent global pandemic, have all had significant negative impacts on share prices – but a sharp recovery followed each one of them. This demonstrates perfectly why stock market investors typically do better than others over the long term.
The ability to look through the “noise” of events large and small, the psychological detachment, is a vital part of an investor’s armoury.
Arguably the world’s most famous investor, Warren Buffett says: “I don’t try to be clever by trading in and out of holdings. Like good wine, my stocks are laid down for long-term appreciation.”
In a similar vein, he adds: “Only buy something that you’d be perfectly happy to hold if the market shut down for 10 years.”
Of course, before investing at all there are a number of crucial considerations, not least of which are the individual’s attitude to risk, and income or capital growth requirements. A long-term horizon is, however, key.
Dividends matter
Turning again to the chart, there is a huge difference between the price return over the period from 1986 to close of play on Friday 4 June 2021 (400%) and the total return, which includes dividends (1,827%).
The price return is simply the increase in the “price”, or in this example the level of the FTSE 100 index in the period.
Keen-eyed readers will note that since the turn of the century, the level of price return seems flat.
Indeed, the media will often report that the index has hardly budged since 1999. While the level of the index is similar at around 7,000, the statement is misleading on two fronts.
First of all, as share prices move, so does the value of companies. On a quarterly basis, the FTSE 100 undergoes a reshuffle, which usually results in two or three stocks being relegated to the FTSE 250 index, and replaced by those at the top of the FTSE 250.
As such, the constituents of 2021 are vastly different from those of 1999, making any comparison “apples and pears”.
- Ian Cowie: six dividend hero trusts for inflation-busting income
- The inflation-proof shares fund managers are backing
- Check out our award-winning stocks and shares ISA
Even more importantly, though, the total return figure incorporates dividends as well as price appreciation.
Enter what Einstein reportedly described as the “eighth wonder of the world”, namely compound interest.
A simple example of the power of compound interest is as follows. An initial investment of just £5,000, with an annual return rate of 10% would, over 70 years, equate to just under £4 million.
The wonder of compounding is that it allows interest to be earned on interest and, over a longer period of time, its true power becomes evident, as the chart displays so clearly.
There are some central themes to investing, but for those invested in the right companies with a long-term horizon, the outcome can be measured and shown as fact.
Of course, the future can never be guaranteed, but armed with the twin defences of a long-term approach and the power of compound interest, investors are well prepared to survive the occasional future onslaught which, as history tells us, will come along again.
These articles are provided for information purposes only. Occasionally, an opinion about whether to buy or sell a specific investment may be provided by third parties. The content is not intended to be a personal recommendation to buy or sell any financial instrument or product, or to adopt any investment strategy as it is not provided based on an assessment of your investing knowledge and experience, your financial situation or your investment objectives. The value of your investments, and the income derived from them, may go down as well as up. You may not get back all the money that you invest. The investments referred to in this article may not be suitable for all investors, and if in doubt, an investor should seek advice from a qualified investment adviser.
Full performance can be found on the company or index summary page on the interactive investor website. Simply click on the company's or index name highlighted in the article.