Vodafone: Here's the share price to catch this falling knife
10th October 2018 08:51
by Alistair Strang from Trends and Targets
The telecoms giant's share price has been in freefall, but it has to stop somewhere. Chartist Alistair Strang sheds light on potential opportunities.

Vodafone (LSE:VOD)
This lots' share price has behaved with similarity to one of these mobile phone contracts which once was a good idea, now rather less so.
In fact, if we dwell on the movement the market made at the start of 2018, it was almost like an immoral advertising campaign to reel in some suckers.
Why?
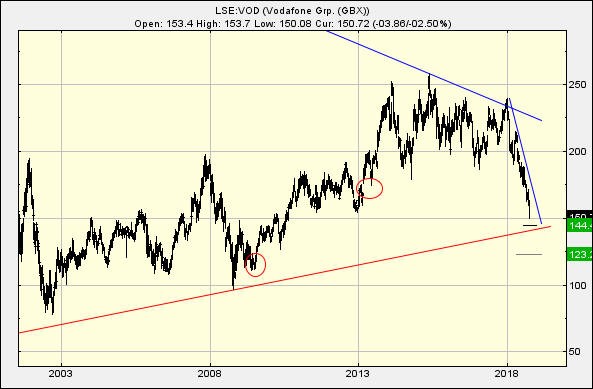
The share price was elevated above the downtrend since the year 2000, a movement which almost advertised itself with the promise of good times ahead.
This was to prove one of these occasions where our boring mantra, demanding "higher highs" can lessen profit potentials but does tend avoid some pitfalls when trading.
The share price managed to 240p, not quite achieving the trend testing prior high of 258p. And then fell off a cliff.
It certainly seems 2018 may be a year Vodafone will prefer to forget but, thankfully for now, some hope is rearing its ugly head.
Essentially, weakness now below 150p calculates with 144p with some bounce potentials. We'd warn, our inclination is to distrust any bounce unless it can carry the price beyond the immediate downtrend at 173p.
This will certainly give potential for recovery as we can mention an initial recovery target at 191p. If exceeded, secondary calculates as a very possible 224p and a donk - once again - against the downtrend from 2018.
As from a fairly reasonable probability of a bounce around the 144p, we'd be pretty concerned if 144p breaks. This opens the door for another truism, the danger of catching falling knifes.
Below 144p - and 123p certainly deserves some consideration in the annals of history, doubtless with a short-lived bounce to again catch bottom feeders.
But, unfortunately, we will again doubtless issue a report which mentions ultimate bottom is at 92p.
Source: Trends and Targets Past performance is not a guide to future performance
Alistair Strang has led high-profile and "top secret" software projects since the late 1970s and won the original John Logie Baird Award for inventors and innovators. After the financial crash, he wanted to know "how it worked" with a view to mimicking existing trading formulas and predicting what was coming next. His results speak for themselves as he continually refines the methodology.
Alistair Strang is a freelance contributor and not a direct employee of Interactive Investor. All correspondence is with Alistair Strang, who for these purposes is deemed a third-party supplier. Buying, selling and investing in shares is not without risk. Market and company movement will affect your performance and you may get back less than you invest. Neither Alistair Strang or Interactive Investor will be responsible for any losses that may be incurred as a result of following a trading idea.
These articles are provided for information purposes only. Occasionally, an opinion about whether to buy or sell a specific investment may be provided by third parties. The content is not intended to be a personal recommendation to buy or sell any financial instrument or product, or to adopt any investment strategy as it is not provided based on an assessment of your investing knowledge and experience, your financial situation or your investment objectives. The value of your investments, and the income derived from them, may go down as well as up. You may not get back all the money that you invest. The investments referred to in this article may not be suitable for all investors, and if in doubt, an investor should seek advice from a qualified investment adviser.
Full performance can be found on the company or index summary page on the interactive investor website. Simply click on the company's or index name highlighted in the article.