Vodafone worth double, but will it ever get there?
28th January 2019 16:59
by Lee Wild from interactive investor
Already complicated enough to analyse, there's now debate about whether Vodafone is growing or shrinking.

Given time to ponder Friday's third-quarter results from Vodafone (LSE:VOD), this analyst still rates the shares a 'buy' and believes that one day they'll be worth considerably more than current prices.
We explained reaction to the three-month numbers that had prompted further selling to 136p, down 5% from 144p at the start of Friday's session. A year ago they were worth 224p, and were above 150p as recently as last Wednesday.
Now, Deutsche Bank analyst Robert Grindle sheds some light on why Vodafone ranks among the most unloved stocks in the FTSE 100 index.
Much of the latest negativity is blamed on the incessant focus on growth, because Vodafone does not publish adjusted cash profit (EBITDA) or free cash flow (FCF) data at first or third quarter trading updates.
"Such is the bane of European telcos (which don't grow much) that small changes in top-line momentum make a big difference to sentiment with regard to the sustainability of sector cashflows and dividends (by way of operational leverage)," writes Grindle.
"The lack of any sustained growth recovery despite elevated capex on once-in-a-(multi) generation project like Fibre-to-the-Home (FTTH), further exacerbates the issue."
It makes forecasting difficult given no one knows quite what the steady-state growth rate is for telecoms businesses. Investors become more pessimistic as growth momentum slows, but without knowing "what a bottom or cycle-adjusted normalised growth rate (or valuation multiple) looks like".
- Vodafone shares mauled by bears again
- A successful chartist's forecast for Vodafone shares
- Vodafone, Burberry, Fevertree
As well as growth, Vodafone has also had to deal with a foreign exchange hit to forecasts, shock departure of CEO Vittorio Colao after 10 years in charge, and worries about using Vodafone shares to pay for big acquisitions. Slower profit growth in Spain and Italy doesn't help either.
An accounting change was also an "act of self-harm," argues Grindle - Vodafone UK now accounts for organic service revenue (OSR) growth including the effect of a move to handset financing. The long-term bull points out that a UK headline decline of 4.5% in the third quarter is actually 0.9% growth if you strip out the elimination of handsets from service revenues in the comparable period.
"The fact of the matter is that Vodafone doesn't run its business for growth and is more focussed on EBITDA, FCF and dividends, targets for which were all reiterated at the Q3 update."
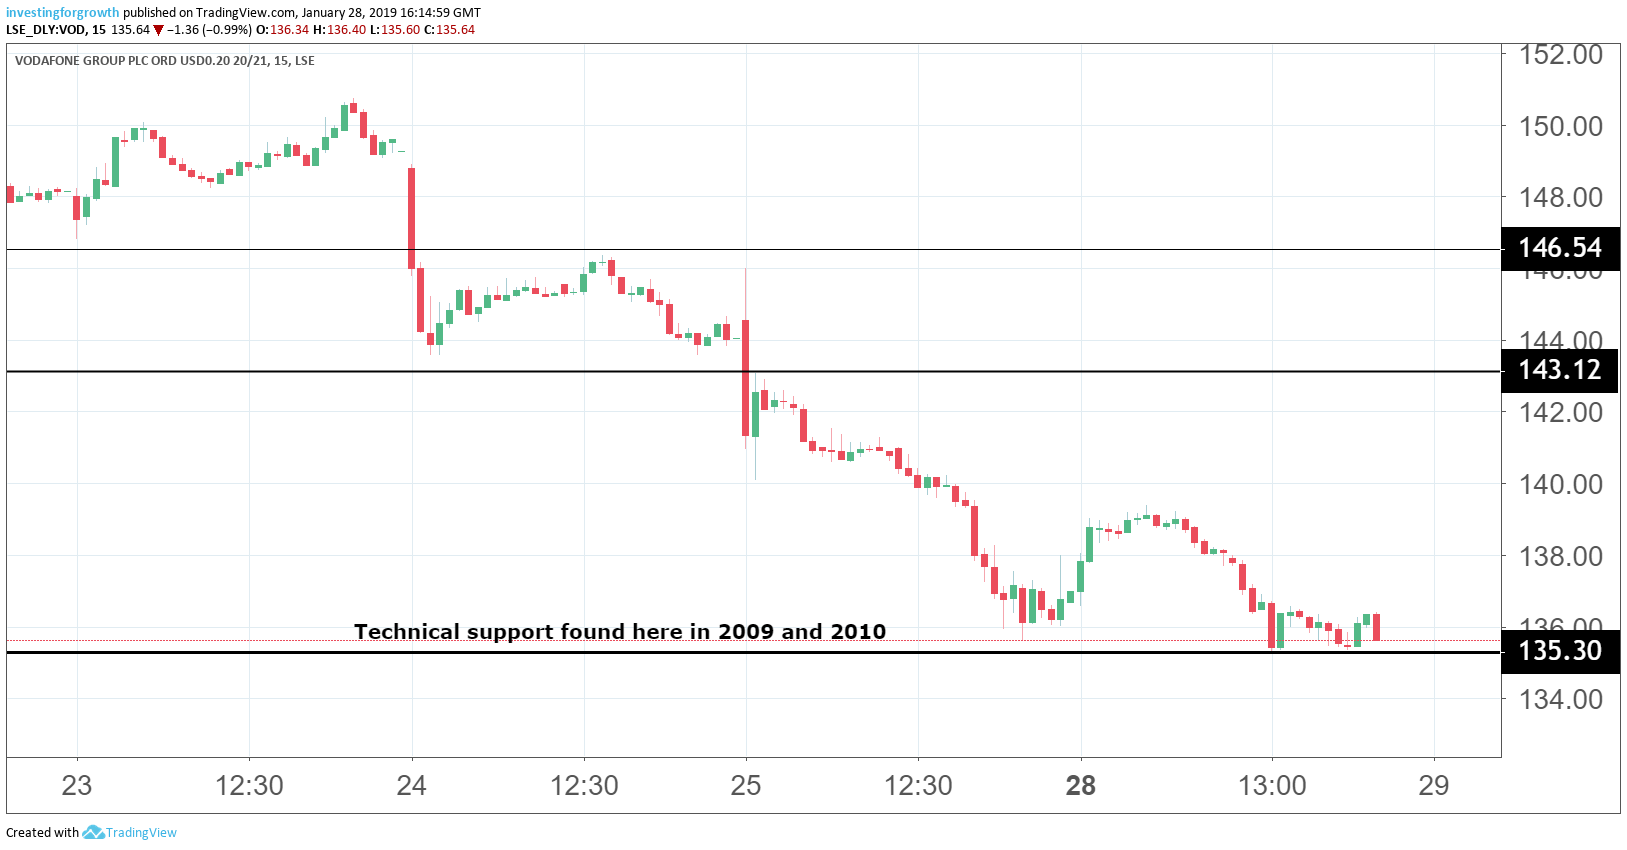
Source: TradingView (*) Past performance is not a guide to future performance
It's complicated
Agreeing whether Vodafone is growing or shrinking very much depends on which accounting method is used.
Vodafone currently use International Accounting Standards (IAS) growth accounting, but is shifting to the International Financial Reporting Standard (IFRS), or IFRS15. Grindle explains the difference:
"Under IAS, Vodafone Group organic service revenues shrank by 0.8% in Q3 19, which was an unhelpful 30 basis points (bps) deterioration on Q2 (chiefly due to South Africa). Excluding UK handset financing effects growth was 0.1%, positive but still a 40bp deterioration.
"Under IFRS15 accounting Group growth actually improved by 10bp between Q2 and Q3, driven by a 50bp improvement in Europe. Would the right growth definition please make itself known!"
What to look for in Q4
Vodafone management believes growth will deteriorate further in the final three months of the year to March 2019, but that this will be the "trough quarter".
Watch out for better growth in South Africa, further commercial momentum with mobile contract and broadband growth and lower churn, and growth across all customer groups rather than just high-end.
"We remain of the view that Vodafone equity is too cheap at current levels," writes Grindle, who still rates Vodafone shares as a 'buy' with 268p price target. "We expect more M&A and improving top line trends in 2019."
*Horizontal lines on charts represent levels of previous technical support and resistance. Trendlines are marked in red.
These articles are provided for information purposes only. Occasionally, an opinion about whether to buy or sell a specific investment may be provided by third parties. The content is not intended to be a personal recommendation to buy or sell any financial instrument or product, or to adopt any investment strategy as it is not provided based on an assessment of your investing knowledge and experience, your financial situation or your investment objectives. The value of your investments, and the income derived from them, may go down as well as up. You may not get back all the money that you invest. The investments referred to in this article may not be suitable for all investors, and if in doubt, an investor should seek advice from a qualified investment adviser.
Full performance can be found on the company or index summary page on the interactive investor website. Simply click on the company's or index name highlighted in the article.