What does chart breakout mean for ASOS shares?
ASOS shares have begun to 'fill the gap' created by last year's profit warning. Here's the outlook.
11th April 2019 09:34
by Alistair Strang from Trends and Targets
ASOS shares have begun to 'fill the gap' created by last year's profit warning. Here's the outlook.

ASOS (LSE:ASC)
Like most folk with interest in the markets, we glance at Google News to catch any important business headlines. A news story panicked us, due to ASOS (LSE:ASC) being "one we cover" and a share we'd been expecting to rise.
A quick glance at what was really happening revealed ASOS had grown by 14%, a motion quite at odds with the headline news. It did make us wonder how many folk bailed positions or dumped shares, thanks to a media intent on the dramatic, when indulging a quick review of a 7am RNS from ASOS.
Folks who dumped shares were doubtless feeling mildly irritated by 10am as the share price peaked for the day.
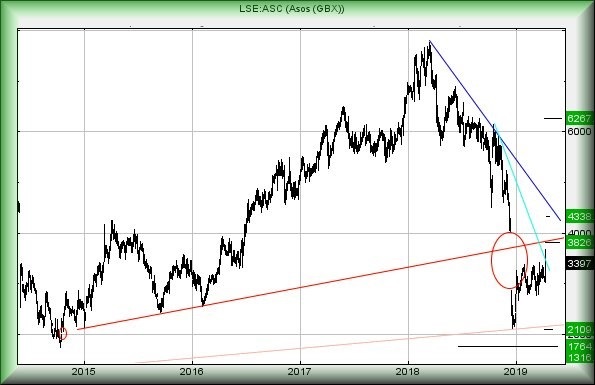
Unfortunately, the story gets worse - or better. The immediate situation is mildly encouraging, the price of ASOS now having closed above the glass ceiling which formed following their "profit warning" in December.
Generally, this is a good thing, moving the share price into a scenario where we can calculate moves now above 3,673p should bring further growth to a modest 3,826p.
If exceeded, our secondary for the longer term comes in at 4,338p, rather neatly covering the circled gap and suggesting the drop was doubtless overcooked.
Despite being able to calculate a rosy future beyond 4,338p, we shall need stir the tea leaves again should such a number appear in the future.
Of course, this is the stock market and always capable of a good giggle at the investor's expense. In the case of ASOS, the share price presently requires to slink below 2,790p to signal incoming danger with reversal to 2,100p initially probable.
Source: TradingView Past performance is not a guide to future performance
Alistair Strang has led high-profile and "top secret" software projects since the late 1970s and won the original John Logie Baird Award for inventors and innovators. After the financial crash, he wanted to know "how it worked" with a view to mimicking existing trading formulas and predicting what was coming next. His results speak for themselves as he continually refines the methodology.
Alistair Strang is a freelance contributor and not a direct employee of Interactive Investor. All correspondence is with Alistair Strang, who for these purposes is deemed a third-party supplier. Buying, selling and investing in shares is not without risk. Market and company movement will affect your performance and you may get back less than you invest. Neither Alistair Strang or Interactive Investor will be responsible for any losses that may be incurred as a result of following a trading idea.
These articles are provided for information purposes only. Occasionally, an opinion about whether to buy or sell a specific investment may be provided by third parties. The content is not intended to be a personal recommendation to buy or sell any financial instrument or product, or to adopt any investment strategy as it is not provided based on an assessment of your investing knowledge and experience, your financial situation or your investment objectives. The value of your investments, and the income derived from them, may go down as well as up. You may not get back all the money that you invest. The investments referred to in this article may not be suitable for all investors, and if in doubt, an investor should seek advice from a qualified investment adviser.
Full performance can be found on the company or index summary page on the interactive investor website. Simply click on the company's or index name highlighted in the article.