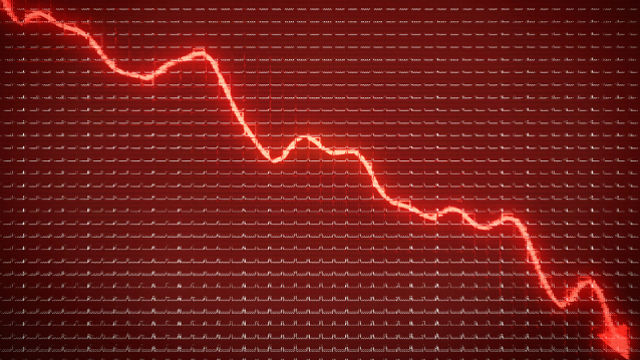
Why you should keep calm and carry on when stock markets fall
Most big market declines teach us a valuable lesson and how best to behave when stocks struggle.
14th October 2019 09:57
by Tom Bailey from interactive investor
Most big market declines teach us a valuable lesson and how best to behave when stocks struggle.
There are at least two ways to look at financial history. One is to focus on average returns. In the past 30 years, the FTSE All-Share index has produced an annualised 8.2% return; since the 1970s the US market has returned around 10% annualised.
The conclusion drawn is that investors should take a long-term approach, ignoring the sort of large market drops that periodically puncture markets, on the understanding that recovery is bound to happen in due course.
A second way to approach the subject is through the prism of big market manias, looking back in wonder at smart people getting caught up in so-called "irrational exuberance". Financial history books are filled with such episodes, from British investors in the South Sea Company to the US housing market in the 2000s. The implicit message is usually to resist the euphoric price rises of such markets: avoid so-called "bubbles."
These two tellings of financial history underpin the two types of market declines that investors may experience: 1) the normal ups and downs of markets that occasionally depart from their long-term upward trajectory, and 2) bubbles, where valuations run far ahead of fundamentals on the back of faulty narratives.
Black Monday
A classic example of a large market decline that was not a bubble was the Black Monday crash on 19 October 1987. On that day, the Dow Jones index plummeted by 22.6%, the index's single biggest decline ever. Fears soon spread to the UK, with the FTSE 100 falling by 10.8% in just 24 hours. Within a week, the index had lost 26.8% of its value. As Julian Chillingworth, chief investment officer of Rathbones, notes:
"The numbers were much bigger than ever seen before."
But the market soon recovered. In the US, stocks took roughly two years to exceed price levels before the crash, while, as Chillingworth points out, had you bought into the UK market on 1 January 1987 and not sold, your yearly returns would have been flat.
Similarly, Andrew Rose, equities fund manager at Schroders, has noted:
"At the time you felt it was the end of the world, but looking back it was just a blip. The UK and the US stock markets rebounded strongly in the late 80s and throughout the 90s."
The speed at which investors' portfolios recovered depended on their market capitalisation focus. As Chillingsworth points out:
"If you were involved in some of the growth mid-cap names, you didn't get your money back for quite some time, while large firms bounced back quite quickly."
But the key lesson for investors from this episode was that large declines are usually followed by a recovery – so long as you wait out the storm. As Spencer Jakab observes in Heads I Win, Tails I Win:
"Markets are a little like a rubber band – the more stretched they get, the likelier they are to snap back in the other direction."
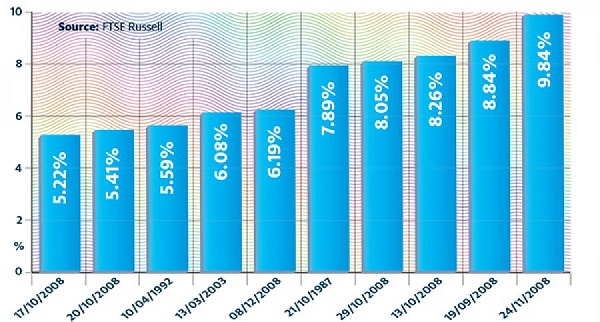
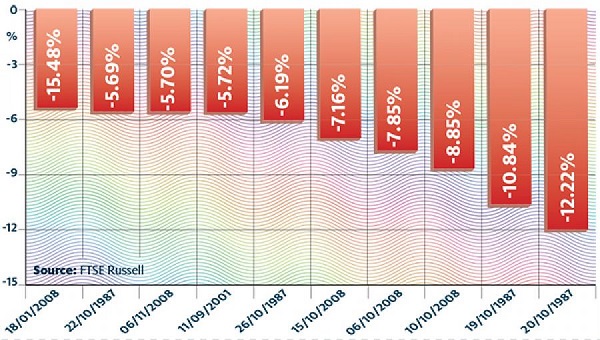
The 10 largest one-day moves in the history of the FTSE 100 index
The biggest FTSE 100 rises in one day
The biggest FTSE 100 falls in one day
The case of Japan
However, this is not always the case. Sometimes stock valuations race so far ahead of reality that they fail to recover – a so-called bubble. Perhaps the clearest example of this over the past 40 years was the bubble in Japanese stocks and property that burst in the early 1990s.
In the late 1980s, Japan's booming economy and market offered a seemingly exciting play for more adventurous investors. Investors were convinced the economy's huge economic growth would continue, leading to soaring valuations for those companies expected to benefit from that growth. Companies such as Cannon or Olympus were trading on price-to-earnings ratios of around 50x, says Chillingworth.
UK investors were heavily involved, with Japanese brokers and banks having a strong presence in London, and a proliferation of unit trusts providing investor access. Sentiment reached such lofty highs that, as Mike Deverell of Equilibrium Asset Management recalls:
"In 1990 Japan was the biggest component of the global stock market."
"But the investing community overestimated the growth an economy will produce," says Chillingworth. Eventually, reality kicked in and the Nikkei stock index fell to half its 1989 peak. And unfortunately for the buy and hold investors in Japan, markets did not recover, with the Nikkei 225 still trading at around half of its December 1989 peak 30 years on.
Even if a UK-based contrarian investor had attempted to hold on, the fund they had invested in would likely have closed during the 1990s, as interest dried up and redemptions continued.
Dot.com
However, some years later a new opportunity caught the eye of investors: the dotcom boom. UK investors enthusiastically embraced the supposed prospects of the New Economy, piling into technology funds that gave them access to the hottest US growth stocks of the day.
According to Brian Dennehy, in his A Short History of Technology Funds, at the start of 1993 there were just five tech funds with a total value of £63.3 million in the UK. By the end of 2000 there were 24 such funds with a total value of £4.7 billion. As Chillingworth notes:
"It was massive. Every management house launched a tech fund."
Leading the pack was Janus Henderson Global Technology, which in 1998 was valued at £114 million. In that year alone, it returned 27%. By September 2000, the fund had grown to £1.65 billion.
Eventually, however, the bubble burst, with the US market taking sharp dives in 2001 and 2002. The US Nasdaq index of technology stocks fell by 78% in total. The FTSE 100, which itself had some frothy tech listings, was also hard hit. Over the course of 2002 the index lost 25%. Funds specifying in tech suffered much more. By August 2002, Henderson Global Technology had lost 86% of its value, according to Dennehy.
As Chillingworth points out, even those invested specifically in tech companies might have ended up recovering from their losses. He says:
"If you owned certain tech companies through the tech bubble and held them, you still did well eventually. If you owned tech names that never turned a profit, probably not so."
The big one
The next big market decline UK investors experienced was the 2008 financial crisis. With the full extent of the crisis becoming clear in 2008, the main UK index ended the year down 31.3%. Nearly every asset was being sold as investors became genuinely apocalyptic.
But eventually calm returned, thanks to the intervention of governments and central banks. While it took until mid-2013 for it to fully recover on a price basis, investors who waited it out would have still benefited from dividend payments (unlike those caught up in the dotcom boom).
However, the key lesson is that typically the fastest recovery in share prices happens just after the crash, so the portfolios of investors who panic and exit the market during the turbulence may take even longer to recover.
These articles are provided for information purposes only. Occasionally, an opinion about whether to buy or sell a specific investment may be provided by third parties. The content is not intended to be a personal recommendation to buy or sell any financial instrument or product, or to adopt any investment strategy as it is not provided based on an assessment of your investing knowledge and experience, your financial situation or your investment objectives. The value of your investments, and the income derived from them, may go down as well as up. You may not get back all the money that you invest. The investments referred to in this article may not be suitable for all investors, and if in doubt, an investor should seek advice from a qualified investment adviser.
Full performance can be found on the company or index summary page on the interactive investor website. Simply click on the company's or index name highlighted in the article.
This article was originally published in our sister magazine Money Observer, which ceased publication in August 2020.
These articles are provided for information purposes only. Occasionally, an opinion about whether to buy or sell a specific investment may be provided by third parties. The content is not intended to be a personal recommendation to buy or sell any financial instrument or product, or to adopt any investment strategy as it is not provided based on an assessment of your investing knowledge and experience, your financial situation or your investment objectives. The value of your investments, and the income derived from them, may go down as well as up. You may not get back all the money that you invest. The investments referred to in this article may not be suitable for all investors, and if in doubt, an investor should seek advice from a qualified investment adviser.
Full performance can be found on the company or index summary page on the interactive investor website. Simply click on the company's or index name highlighted in the article.