What’s the outlook for gold?
Independent analyst Alistair Strang considers whether the precious metal has finished its dig downwards.
16th August 2023 08:39
by Alistair Strang from Trends and Targets

The price of gold often fails to comply with our in-house logic when it's heading upwards. Yet, when it’s heading downwards, our projections are often devastatingly correct. Historically, once things get above the $2,000 level, it almost feels like a human somewhere has intervened and said “nope!”. Obviously this is a silly concept in a free and fair marketplace.
- Invest with ii: Top UK Shares | Share Tips & Ideas | Cashback Offers
The chart below highlights that the market has tended to lose confidence in the price of the precious metal virtually the moment it dares exceed an imaginary line. Curiously, in April this year, for a moment we thought the price was going to get away with a rise and for four weeks, it finally felt like the price was going to break upwards. But when the surge arrived at the start of May, rather than accelerate above the 2,100 level, the price opted to spoil the fun for all the folk who’d long positions and, currently, we feel the dig downwards hasn’t yet concluded.
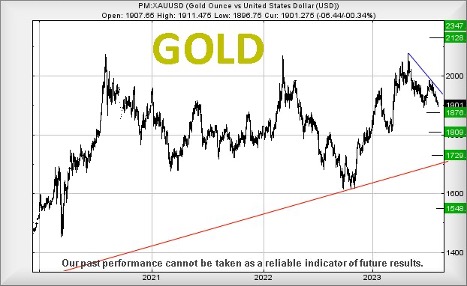
Source: Trends and Targets. Past performance is not a guide to future performance.
However, it may be worth remembering the degree of mucking about during April tends to suggest the imaginary ceiling at around $2,070 may be weakening. In fact, if the price now manages above $2,077, conventional thinking suggests a fourth stab at the glass ceiling should break it, perhaps triggering movement to an initial 2,128 with our secondary, if bettered, calculating at $2,347. While these targets fail to align with the fantastic ambition of $3,000 mentioned by industry “analysts”, these same experts have been predicting the $3,000 level since 2009.
For now, it feels like gold has entered a reversal cycle, one where weakness next below $1,896 risks triggering travel down to an initial $1,876 with secondary, if broken, working out at 1,809. Usually, we’d be happy to ridicule such a secondary, but visually the metal was trading at such a level last March and, therefore, such an ambition is liable to be far from stupid. In fact, glancing at the chart, it actually makes quite a bit of sense.
We’ve displayed our target levels below 1,809, should everything go wrong. Surprisingly, neither of them make much visual sense, so we currently distrust the calculations.
Alistair Strang has led high-profile and "top secret" software projects since the late 1970s and won the original John Logie Baird Award for inventors and innovators. After the financial crash, he wanted to know "how it worked" with a view to mimicking existing trading formulas and predicting what was coming next. His results speak for themselves as he continually refines the methodology.
Alistair Strang is a freelance contributor and not a direct employee of Interactive Investor. All correspondence is with Alistair Strang, who for these purposes is deemed a third-party supplier. Buying, selling and investing in shares is not without risk. Market and company movement will affect your performance and you may get back less than you invest. Neither Alistair Strang or Interactive Investor will be responsible for any losses that may be incurred as a result of following a trading idea.
These articles are provided for information purposes only. Occasionally, an opinion about whether to buy or sell a specific investment may be provided by third parties. The content is not intended to be a personal recommendation to buy or sell any financial instrument or product, or to adopt any investment strategy as it is not provided based on an assessment of your investing knowledge and experience, your financial situation or your investment objectives. The value of your investments, and the income derived from them, may go down as well as up. You may not get back all the money that you invest. The investments referred to in this article may not be suitable for all investors, and if in doubt, an investor should seek advice from a qualified investment adviser.
Full performance can be found on the company or index summary page on the interactive investor website. Simply click on the company's or index name highlighted in the article.