Zephyr Energy is in higher high territory
2nd September 2021 10:08
by Alistair Strang from Trends and Targets
Our charts expert examines the price movements of an oil and gas firm which is showing promising signs.

An email asked us to review Zephyr Energy (LSE:ZPHR),which despite its website wording, actually appears to have reasonably solid potentials if triggers are exceeded.
It's an oil & gas producer but a Google search yielded this as the first search result; 'Zephyr'sprimary focus is the development of a high-impact appraisal project in Utah's Paradox.' Unfortunately, this opening sentence tells a casual visitor nothing.
Thankfully, there's a simple map which advises the company operate in North Dakota, Colorado, and Utah too, along with useful information explaining they are an investment platform, formed to develop oil and gas interests in the Rocky Mountains.
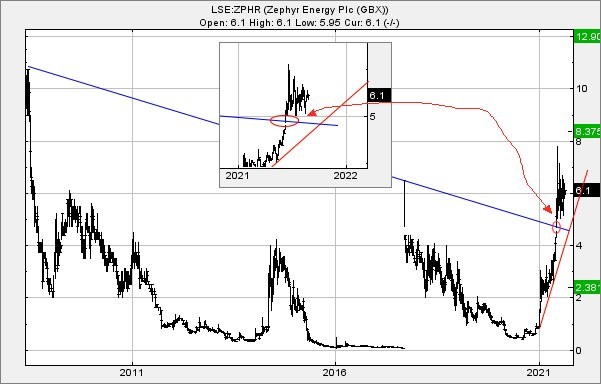
One thing did interest us, quite a lot, and it wasn't revealed until we reviewed historical share price data. The download dated back to 2004 when they presumably listed in London on the AIM market.
The company share price is currently trading around 6p, achieving levels not seen since 2008 and cheerfully exceeded three previous upward attempts during the intervening years. It's therefore officially in 'Higher High' territory, hopefully able to provide some optimism for the longer term. An additional reason for optimism was provided in June this year.
- Read more of our technical analysis content here
- Subscribe to the ii YouTube channel for our latest interviews
Circled, the share price was gapped (manipulated) up, a movement failing to make sense at first glance until we opted to draw a downtrend, one which dated back to a period in 2008 when the share price was above 10p.
We're always quite pleased when this sort of thing is shown. It tends imply a very deliberate decision to remove a price from a downtrend, commencing a new trend.
At present, we can calculate 7.1p as enjoying trigger level potentials. Movement above this level should prove capable of an attempt at 8.37p in the future, then things get useful. By achieving such a level and hopefully bettering it, we can calculate a distant target of 12.9p as being available.
This almost sounds ridiculous when applied to a share which was trading below 0.5p less than a year ago but regardless of common sense, the potentials for further growth certainly exist.
To get into trouble, the share price needs sink below Red on the chart, currently around 4p. This risks provoking reversal to 2.38p and that's it. We cannot calculate below such a level.
Source: Trends and Targets. Past performance is not a guide to future performance.
Alistair Strang has led high-profile and "top secret" software projects since the late 1970s and won the original John Logie Baird Award for inventors and innovators. After the financial crash, he wanted to know "how it worked" with a view to mimicking existing trading formulas and predicting what was coming next. His results speak for themselves as he continually refines the methodology.
Alistair Strang is a freelance contributor and not a direct employee of Interactive Investor. All correspondence is with Alistair Strang, who for these purposes is deemed a third-party supplier. Buying, selling and investing in shares is not without risk. Market and company movement will affect your performance and you may get back less than you invest. Neither Alistair Strang or Interactive Investor will be responsible for any losses that may be incurred as a result of following a trading idea.