Chart of the week: Another miracle from this star share?
Having enjoyed an incredible rally, our technical analyst asks if solid chart resistance can be broken.
4th March 2019 10:29
by John Burford from interactive investor
Having enjoyed an incredible rally, our technical analyst asks if solid chart resistance can be broken.

Is it 'Open Sesame' for Alibaba shares?
The company that Jack Ma famously built into China's biggest retailer is a favourite trading vehicle for UK investors/traders – and no wonder. Mr Ma is seen as being a miracle worker in the potentially biggest consumer market on earth.
What Amazon (NASDAQ:AMZN) has done for the USA (and elsewhere), Alibaba (NYSE:BABA) can do for China (and elsewhere). The story is irresistible, is it not?
But just as most great financial stories appear to be a no-brainer at the start, it often encounters difficulties along the pathway to economic heaven. And that is where some astute chart reading can offer clues that the rocket of share price growth can be seen to be sputtering in the rarified atmosphere of extreme valuations.
And that is what happened last year as the shares rocketed to the $210 level.
Here is the weekly chart showing the tremendous bull run from September 2015 to June 2018:
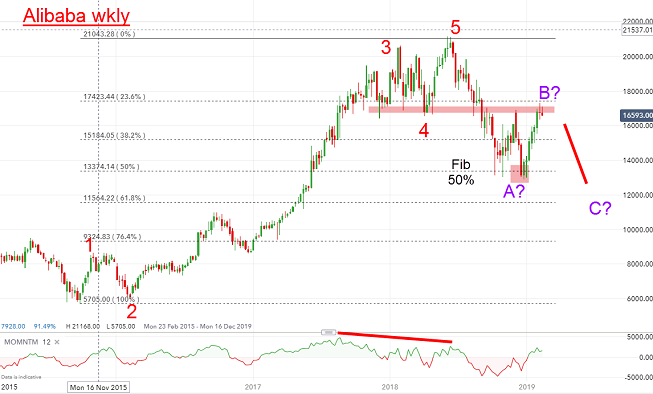
Source: interactive investor Past performance is not a guide to future performance
Again, I have a classic five-up to the $210 high on a strong momentum divergence. And from that high, the shares have retreated down to the Fibonacci 50% retrace - a normal correction. And from that $132 Christmas low, the shares have rebounded with the general market to the $170 level.
Here is a close up of recent action:
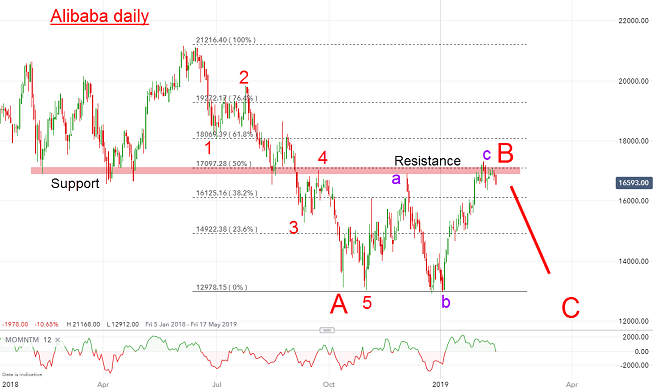
Source: interactive investor Past performance is not a guide to future performance
The B wave rally has also retraced a Fibonacci 50% to where solid chart resistance lies. That $170 zone was solid support until September when the shares broke down through it in the A wave. It is now resistance.
So, with the shares again trying to push through, the odds are against it and therefore represents a 'sell' area.
A decline from here would set up a C wave target well below the A wave low at $130.
Chinese shares have been buoyant of late in anticipation the authorities would kick off another round of massive stimulus as GDP growth has been ebbing away.
Loans to companies have been expanding which indicates that move is already on. So, is this a case of 'Buy the Rumour, Sell the News'?
Only a sharp push above the $170 zone would cancel my forecast.
John Burford is the author of the definitive text on his trading method, Tramline Trading. He is also a freelance contributor and not a direct employee of interactive investor.
These articles are provided for information purposes only. Occasionally, an opinion about whether to buy or sell a specific investment may be provided by third parties. The content is not intended to be a personal recommendation to buy or sell any financial instrument or product, or to adopt any investment strategy as it is not provided based on an assessment of your investing knowledge and experience, your financial situation or your investment objectives. The value of your investments, and the income derived from them, may go down as well as up. You may not get back all the money that you invest. The investments referred to in this article may not be suitable for all investors, and if in doubt, an investor should seek advice from a qualified investment adviser.
Full performance can be found on the company or index summary page on the interactive investor website. Simply click on the company's or index name highlighted in the article.
Disclosure
We use a combination of fundamental and technical analysis in forming our view as to the valuation and prospects of an investment. Where relevant we have set out those particular matters we think are important in the above article, but further detail can be found here.
Please note that our article on this investment should not be considered to be a regular publication.
Details of all recommendations issued by ii during the previous 12-month period can be found here.
ii adheres to a strict code of conduct. Contributors may hold shares or have other interests in companies included in these portfolios, which could create a conflict of interests. Contributors intending to write about any financial instruments in which they have an interest are required to disclose such interest to ii and in the article itself. ii will at all times consider whether such interest impairs the objectivity of the recommendation.
In addition, individuals involved in the production of investment articles are subject to a personal account dealing restriction, which prevents them from placing a transaction in the specified instrument(s) for a period before and for five working days after such publication. This is to avoid personal interests conflicting with the interests of the recipients of those investment articles.