Chart of the week: are the oil majors really a buy?
Our chartist argues these are undervalued and that fossil fuel demand is not going anywhere.
19th October 2020 11:14
by John Burford from interactive investor
Analysts are bearish on big oil stocks, but our chartist argues these are undervalued and that fossil fuel demand is not going anywhere.

In true contrarian spirit, I have been going against the consensus recently with several shares that passed through my buy low/sell high filter (see my recent columns for more). But is today’s selection of the oil majors sticking my neck out a tad too far?
After all, bullish sentiment towards them is very hard to find among the analysts – and public alike. There is a well-orchestrated and well-financed campaign to reduce and then ban fossil fuels, with the UK government having mandated a ‘net zero’ target by 2050 – a mere 30 years hence.
Given that over 87% of our energy is still derived from this source, this net zero target is surely a huge ask - depending on how you define ‘net zero’ of course!
In any case, it is highly unlikely that fossil fuels will be phased out entirely, especially in the less-developed regions. And of course, the oil majors are not sitting around waiting for their revenues to collapse. Far from it.
But is the use of fossil fuels in decline yet, as would be expected given the extensive ‘global warming crisis’ media publicity?
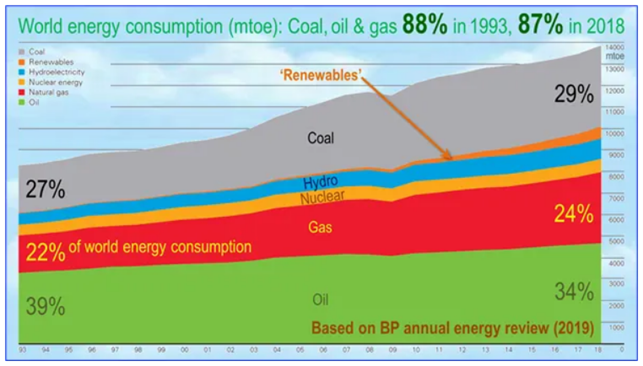
Sadly for the net zero target, it appears not. The world’s consumption of coal and gas is actually rising, while oil is flat. So maybe we shouldn’t be so quick to write them off.
- ii view: oil major Total strengthens green transformation
- ii view: Shell slashes costs amid shift to low-carbon energy
And renewables, although rising sharply from a low base, are still the underdog. Is it likely these will swamp the others in 30 years?
So let’s see what kind of a bullish case I can make for the majors. The charts of BP (LSE:BP.) and Royal Dutch Shell (LSE:RDSB) are broadly similar and I can hold the same conclusions for either, so I will look at BP. Here is the long-term weekly chart since 2016:
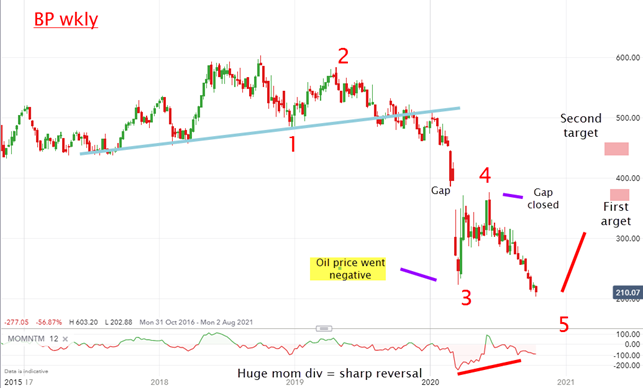
Source: interactive investor. Past performance is not a guide to future performance.
Overproduction, especially from the US frackers as they fought a price war with OPEC, lead to the growing bearish sentiment and the price collapse to the March corona crash low at £2.20 – a newsworthy event since the oil price went temporarily negative then.
With buyers being paid to take the stuff off the sellers’ hands, how could sentiment get any darker?
Investors’ bargepoles were being brought out of retirement in droves.
The bounce off this low filled the large gap, from where the market did its usual thing and reversed downwards. And last week, with more signs another price war is threatening – this time including Russia – the share price collapsed to the multi-decade low of £2.09 on Thursday.
- ii view: BP begins to reinvent itself
- Take control of your retirement planning with our award-winning, low-cost Self-Invested Personal Pension (SIPP)
But note the huge momentum divergence at this low – a sure sign selling pressure has been rapidly drying up in recent months and smart money is coming in.
And what about the oil price? Is that making new lows? Far from it! Brent crude is trading around the $43 (£33) region – far above its March low. So we have a huge divergence here with the share price that is making new lows.
If I am correct, we may have here one of the best opportunities to pick up shares in classy companies with modest downside risk, if any. I am adding them to my buy low/sell high list. My first target is around £3.50, and the projected dividend yield is over 7%.
For more information about Tramline Traders, or to take a three-week free trial, go to www.tramlinetraders.com.
John Burford is the author of the definitive text on his trading method, Tramline Trading. He is also a freelance contributor and not a direct employee of interactive investor.
These articles are provided for information purposes only. Occasionally, an opinion about whether to buy or sell a specific investment may be provided by third parties. The content is not intended to be a personal recommendation to buy or sell any financial instrument or product, or to adopt any investment strategy as it is not provided based on an assessment of your investing knowledge and experience, your financial situation or your investment objectives. The value of your investments, and the income derived from them, may go down as well as up. You may not get back all the money that you invest. The investments referred to in this article may not be suitable for all investors, and if in doubt, an investor should seek advice from a qualified investment adviser.
Full performance can be found on the company or index summary page on the interactive investor website. Simply click on the company's or index name highlighted in the article.
Disclosure
We use a combination of fundamental and technical analysis in forming our view as to the valuation and prospects of an investment. Where relevant we have set out those particular matters we think are important in the above article, but further detail can be found here.
Please note that our article on this investment should not be considered to be a regular publication.
Details of all recommendations issued by ii during the previous 12-month period can be found here.
ii adheres to a strict code of conduct. Contributors may hold shares or have other interests in companies included in these portfolios, which could create a conflict of interests. Contributors intending to write about any financial instruments in which they have an interest are required to disclose such interest to ii and in the article itself. ii will at all times consider whether such interest impairs the objectivity of the recommendation.
In addition, individuals involved in the production of investment articles are subject to a personal account dealing restriction, which prevents them from placing a transaction in the specified instrument(s) for a period before and for five working days after such publication. This is to avoid personal interests conflicting with the interests of the recipients of those investment articles.