Chart of the week: Are Tesco shares a buy now?
21st May 2018 14:11
by John Burford from interactive investor
With the recent avalanche of bullish comments in the mainstream media on this company that has put it into the spotlight, I thought I would chip in with my chart analysis.
Many are touting it as a solid recovery play. As you know, I am mainly searching for contrarian trades, so is this a candidate for a sell? Let's find out.
The shares have certainly fallen hard in recent years for the well-rehearsed negative factors that have engulfed the UK food retailers.
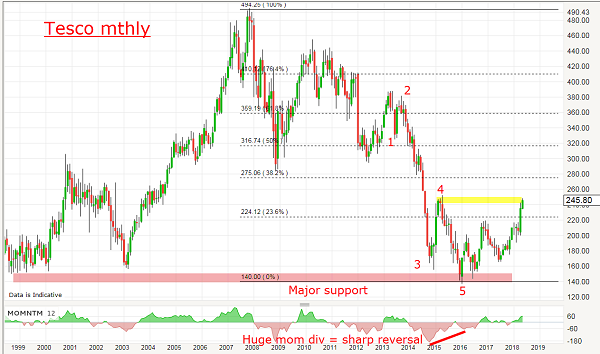
Here is the sad story on the monthly chart:

Source: interactive investor Past performance is not a guide to future performance
It is not a pretty sight for long-term investors. This is yet another condemnation of the 'buy and hold' strategy so favoured by lazy investors.
Incidentally, an investment in in the 1990s was considered a no-brainer as large supermarket chains were considered recession-proof since we all have to eat. That was in stark contrast to the then-fashionable dotcom start-up boom with huge burn rates. How wrong they were! They all crashed!
Very few foresaw the huge deflationary forces at work that witnessed a sea change in consumer buying habits. There was little need for the super-expensive mega-stores that Tesco was infamous for. And the rapidly emerging strength of the German Aldi and Lidl challengers at the lower end (where Tesco was once dominant) was likewise not on the radar.
So from the £5 high in November 2007, it has declined to the low of £1.40 in January 2016. And from that low, the shares have edged up to the current £2.45 area
The first point is that the low came at the end of a completed impulsive Elliott wave (EW) pattern of five waves. According to the EW theory, after five down waves comes a three-wave upward correction - and that is what I expect to see. Also, the £1.40 low lies right at the major long-term support from 2000-2003, which appears to be very solid.
The second point is that at the final wave 5 low, there is a huge momentum divergence, indicating a likely very sharp recovery is on the cards. The weak rally so far hardly qualifies for that description, so further upside can be expected.
But at the current £2.45 level, the market is testing the area of the previous fourth wave (yellow bar) - and this is a typical area where pull-backs can be expected.
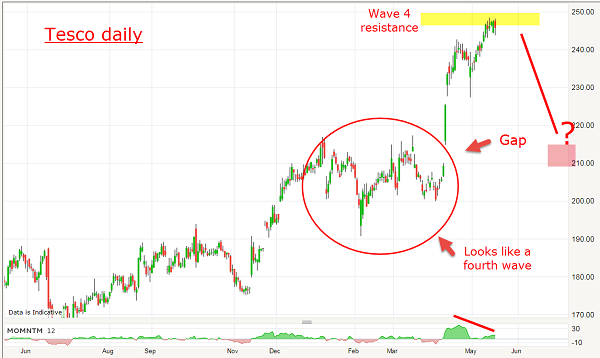
Here is a close-up on the daily chart:

Source: interactive investor Past performance is not a guide to future performance
The strong surge out of a fourth wave on 12 April has created a large gap, but now with the market into overhead resistance, we have a large momentum divergence which spells caution if you expect further upside near-term.
In fact, it appears much more likely the shares will fall back and perhaps fill the gap at the £2.10 area where major support resides.
So yes, I remain bullish, but with the caveat that near-term, a dip to the £2.10 area appears likely and that would represent a much better entry. Only a decline below £1.90 would send me back to the drawing board.
These articles are provided for information purposes only. Occasionally, an opinion about whether to buy or sell a specific investment may be provided by third parties. The content is not intended to be a personal recommendation to buy or sell any financial instrument or product, or to adopt any investment strategy as it is not provided based on an assessment of your investing knowledge and experience, your financial situation or your investment objectives. The value of your investments, and the income derived from them, may go down as well as up. You may not get back all the money that you invest. The investments referred to in this article may not be suitable for all investors, and if in doubt, an investor should seek advice from a qualified investment adviser.
Full performance can be found on the company or index summary page on the interactive investor website. Simply click on the company's or index name highlighted in the article.
Disclosure
We use a combination of fundamental and technical analysis in forming our view as to the valuation and prospects of an investment. Where relevant we have set out those particular matters we think are important in the above article, but further detail can be found here.
Please note that our article on this investment should not be considered to be a regular publication.
Details of all recommendations issued by ii during the previous 12-month period can be found here.
ii adheres to a strict code of conduct. Contributors may hold shares or have other interests in companies included in these portfolios, which could create a conflict of interests. Contributors intending to write about any financial instruments in which they have an interest are required to disclose such interest to ii and in the article itself. ii will at all times consider whether such interest impairs the objectivity of the recommendation.
In addition, individuals involved in the production of investment articles are subject to a personal account dealing restriction, which prevents them from placing a transaction in the specified instrument(s) for a period before and for five working days after such publication. This is to avoid personal interests conflicting with the interests of the recipients of those investment articles.