Chart of the week: Can this bank share break out?
These shares have hit major resistance, but there is a way to profit, says our technical analyst.
11th March 2019 11:10
by John Burford from interactive investor
These shares have hit major resistance, but there is a way to profit, says our technical analyst.

Citigroup – will it ever recover?
Long-time readers will know that I have been overall bearish on the large banks for some time. But as a swing trader who hopes to benefit from both up and down swings, the short-term price charts have offered some excellent in-out opportunities in recent months.
Citigroup (NYSE:C) is a major US banking giant and, along with our domestic majors such as Lloyds (LSE:LLOY) and Barclays (LSE:BARC), has been receiving some bullish comment of late.
The consensus seems to be that banking is now on a surer footing than it was 10 years ago just prior to the Credit Crunch debacle.
So, let's see if that stacks up with the evidence provided by my technical analysis.
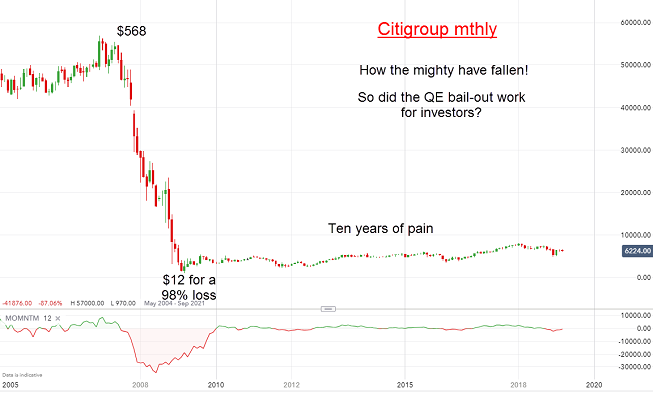
To remind ourselves of the carnage inflicted on banks in the 2008/2009 wipe-out, here is the monthly chart:
Source: interactive investor Past performance is not a guide to future performance
From the high of $568 back in December 2006, the shares plunged in just 15 months to reach a low around the $12 level for a stunning loss of 98%. How many investors in late 2006 could envision such a collapse?
This was a stunning display of why the common ‘buy-and-hold’ investment strategy fails except in very rare circumstances (that cannot be forecast beforehand).
Note the banking and financial shares led the general decline into the March 2009 low – Happy Tenth Anniversary!
So, this is the background to the extremely limp 10-year recovery to the recent $80 high. Despite the enormous $4.5 trillion of QE the Fed pumped into the US banking system with near-zero interest rates for years on end, the shares have managed only the weakest of recoveries.
But this gloomy long-term picture doesn’t mean there were no swing trading opportunities! For instance, the move down from the January 2018 high at $80 to the December 2018 low at $48 is a move of 40%. Capturing even half of that would have resulted in a decent move of 20%.
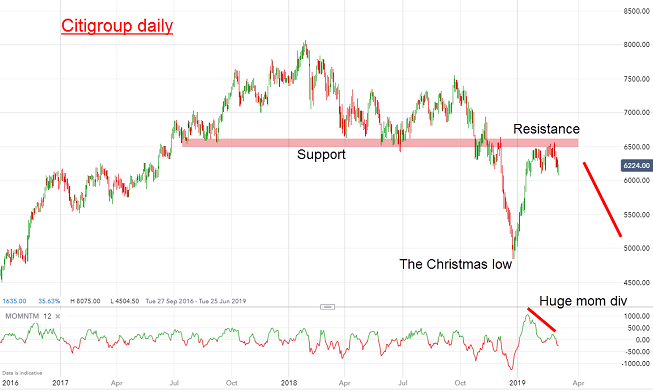
Where are we now – is there a good high probability/low risk swing trade on? I believe there is – here is the daily chart:
Source: interactive investor Past performance is not a guide to future performance
From the Christmas low at $48, the shares rallied strongly to the recent high at $65. The January-March rally in the major indexes (Dow and S&P 500) was one of the strongest I have encountered. It was virtually straight up for days on end as investors 'bought the dip' as they had been doing for 10 years.
But now these shares have hit major resistance. First, I have a band of resistance (pink zone) at the $65 region which should prove formidable.
Second, the $65 level is at the Fibonacci 62% retrace of the entire move off the $80 high to the $48 low – another strong resistance zone. And third, I have a massive momentum divergence into the $65 high that indicates rapidly weakening buying force.
With that bearish firepower on display, it would take an enormous force to push the shares firmly above this resistance.
In my opinion, this is an opportunity to take profits on longs and to position short. Remember, just because a share's price is low doesn't mean it is a strong candidate for the Buy Low/Sell High list!
John Burford is the author of the definitive text on his trading method, Tramline Trading. He is also a freelance contributor and not a direct employee of interactive investor.
These articles are provided for information purposes only. Occasionally, an opinion about whether to buy or sell a specific investment may be provided by third parties. The content is not intended to be a personal recommendation to buy or sell any financial instrument or product, or to adopt any investment strategy as it is not provided based on an assessment of your investing knowledge and experience, your financial situation or your investment objectives. The value of your investments, and the income derived from them, may go down as well as up. You may not get back all the money that you invest. The investments referred to in this article may not be suitable for all investors, and if in doubt, an investor should seek advice from a qualified investment adviser.
Full performance can be found on the company or index summary page on the interactive investor website. Simply click on the company's or index name highlighted in the article.
Disclosure
We use a combination of fundamental and technical analysis in forming our view as to the valuation and prospects of an investment. Where relevant we have set out those particular matters we think are important in the above article, but further detail can be found here.
Please note that our article on this investment should not be considered to be a regular publication.
Details of all recommendations issued by ii during the previous 12-month period can be found here.
ii adheres to a strict code of conduct. Contributors may hold shares or have other interests in companies included in these portfolios, which could create a conflict of interests. Contributors intending to write about any financial instruments in which they have an interest are required to disclose such interest to ii and in the article itself. ii will at all times consider whether such interest impairs the objectivity of the recommendation.
In addition, individuals involved in the production of investment articles are subject to a personal account dealing restriction, which prevents them from placing a transaction in the specified instrument(s) for a period before and for five working days after such publication. This is to avoid personal interests conflicting with the interests of the recipients of those investment articles.