Chart of the week: can Lloyds Bank shares continue this recovery?
13th September 2022 07:59
by John Burford from interactive investor
After a strong September so far for Lloyds shares, analyst John Burford explains what his charts tell us about possible future direction, and whether this rally has legs.
Rates are higher – Lloyds Bank will follow
I make no excuses for returning to Lloyds Banking Group (LSE:LLOY) as it is the UK's largest consumer-focused bank – and its shares are at an interesting juncture. It is a share I have followed closely since my early days with COTW, and it is one of the most heavily traded UK shares with a very wide following.
But in terms of buy-and-hold, it has been an utter disaster, falling from its 545p all-time high at the start of the Millennium to the depths of the Credit Crunch low in 2009 to the absolute bargain basement price of 16p for a loss of an astounding 97%.
That kind of loss is usually associated with debt-ridden over-hyped crypto start-ups, not one of the UK's major banks. The extreme selling was prompted by the fearful vision of our banks going the way of Northern Rock.
- Find out about: Trading Account | Share prices today | Top UK shares
But since that low, the shares have made very fitful moves higher (with large dips along the way). In fact, it has turned out to be a very popular day trading share, but does it have longer-term potential for gains? I believe it does.
The Corona Crash a little over two years ago produced another sharp decline to the 23p low and, since then, the shares have edged higher. Note that this very slight improvement took place when interest rates were abnormally low and house prices and housing activity were very high. Thus, profit margins on mortgage loans were unusually thin.
And with interest rates now perking up, margins are set to improve markedly. Overall profits could more than compensate for the expected drop in house prices and activity that may or may not materialise.
Also, we have a brand-new government that seems committed to revamping Treasury operations and restoring market's belief in its competence. We may also see changes in how it deals with the Bank of England.
But what are the charts telling me?
Past performance is not a guide to future performance.
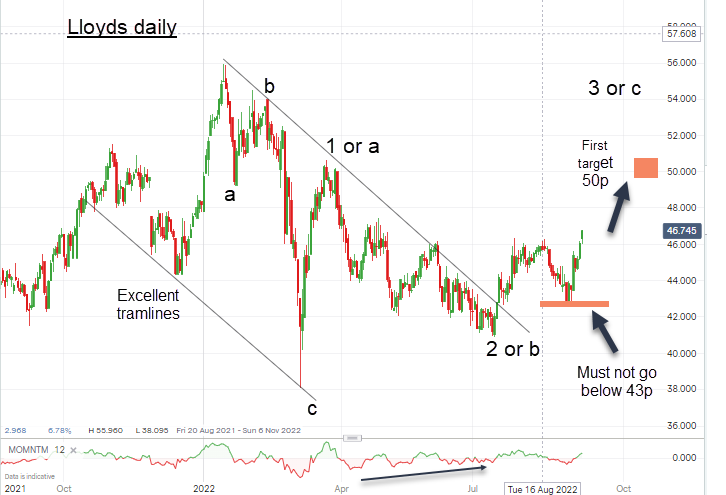
I have excellent tramlines on the daily chart, with the significant break of the upper tramline on 19 July that heralded a bull phase.
- There's hope for Lloyds Bank's share price following recent recovery
- Lloyds Bank shares tipped to rally back to 2015 prices
- Do British prime ministers influence economic growth?
A normal pull-back to the 43p low on 2 September was met with heavy buying. Note that this low fell far short of a 'kiss' on the upper tramline which is the normal expectation – and this demonstrates a very strong buying presence.
Provided this low can hold, my first target is the 50p region, with solid potential to reach my next target at the old high at 56p.
John Burford is a freelance contributor and not a direct employee of interactive investor.
These articles are provided for information purposes only. Occasionally, an opinion about whether to buy or sell a specific investment may be provided by third parties. The content is not intended to be a personal recommendation to buy or sell any financial instrument or product, or to adopt any investment strategy as it is not provided based on an assessment of your investing knowledge and experience, your financial situation or your investment objectives. The value of your investments, and the income derived from them, may go down as well as up. You may not get back all the money that you invest. The investments referred to in this article may not be suitable for all investors, and if in doubt, an investor should seek advice from a qualified investment adviser.
Full performance can be found on the company or index summary page on the interactive investor website. Simply click on the company's or index name highlighted in the article.
Disclosure
We use a combination of fundamental and technical analysis in forming our view as to the valuation and prospects of an investment. Where relevant we have set out those particular matters we think are important in the above article, but further detail can be found here.
Please note that our article on this investment should not be considered to be a regular publication.
Details of all recommendations issued by ii during the previous 12-month period can be found here.
ii adheres to a strict code of conduct. Contributors may hold shares or have other interests in companies included in these portfolios, which could create a conflict of interests. Contributors intending to write about any financial instruments in which they have an interest are required to disclose such interest to ii and in the article itself. ii will at all times consider whether such interest impairs the objectivity of the recommendation.
In addition, individuals involved in the production of investment articles are subject to a personal account dealing restriction, which prevents them from placing a transaction in the specified instrument(s) for a period before and for five working days after such publication. This is to avoid personal interests conflicting with the interests of the recipients of those investment articles.