Chart of the week: A contrarian call on the FTSE 100
29th October 2018 12:33
by John Burford from interactive investor
After calling the stockmarket sell-off correctly, technical analyst John Burford answers the burning question: where to from here?

Whither FTSE now it has dropped to my target?
With the recent horrific plunge in global shares – including many in the FTSE 100 – I thought this is a good juncture to offer my thoughts on that index. I understand many investors are puzzled and somewhat shell-shocked by the severity of the declines.
After all, we were being told the global economy was on firm footing and there were confident forecasts by the IMF and others that growth this year and next would increase to 3.9% (they cited the recent US tax changes as a major factor).
And oil prices were firm as were many industrial metals, so equities were set fair were they not?
• Chart of the week: Is FTSE 100 really oversold?
• Top 10 FTSE 100 income stocks yield an average of 7.1%
• FTSE 100: A history lesson that could help predict the future
But a funny thing happened on the way to this economic nirvana.
Suddenly, the market finally noted that US interest rates were climbing rapidly and the assumed forever-benign conditions were no longer guaranteed. And that wake-up call threw a very hefty spanner in the bull works as it shook it out of its historic complacency.
So, was this severe downturn foreseeable?
I maintain it was, especially (if anyone read my COTW Is the FTSE 100 breaking down? of 18 September – just two weeks before the Dow all-time high!). This was the chart I posted then:
Source: interactive investor Past performance is not a guide to future performance
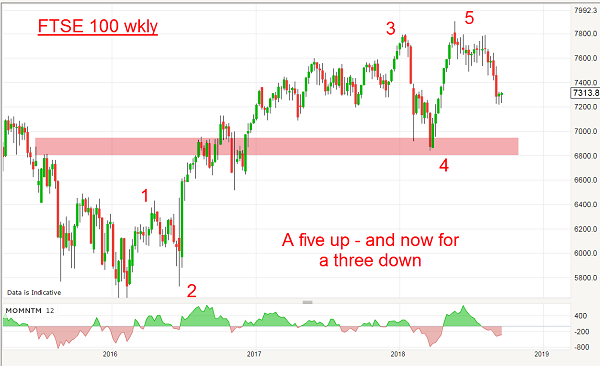
I had been following the progress of the waves from the 2016 lows and when the new high was made in May at the 7,900 zone, I labelled this as the final fifth wave of the sequence and the most likely outcome would be a turn down (read my COTW of 18 Sept (see link above) for my full bearish analysis).
I was simply following the basic observation that following a complete five wave up impulsive pattern, the next trend runs down and counter to that trend.
And I also knew that major market highs are always put in when economic conditions appear great because that is when bullish sentiment is running hot. These are the ideal conditions for tops.
And that is why good traders become super bearish when the herd is super bullish. And by acting against your basic instincts, you rise above the crowd and stand to reap major rewards.
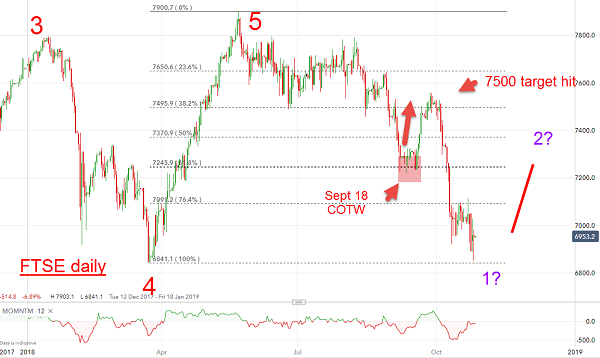
Right after my 18 September post, the market rallied as expected to the 7,500 area target and then promptly fell off the cliff
Source: interactive investor Past performance is not a guide to future performance
And it reached another major target at the previous wave 4 low at the 6,900 zone, which is a full 1,000 points off the May high. Ouch!
But where to from here is the burning question. Let's examine.
First, bullish sentiment has plummeted (In the S&P 500 Index, to a measly 10% bulls), so a rally could well get started from around here in the US and UK. I consider that a very short-term oversold indication.
Second, the market has met a very important chart support area at the wave 4 low. This is often where wave 1 of a new bear trend terminates before a counter-trend wave 2 rally starts (but not always).
Third, and on the other hand, I see no real signs of panic selling just yet so there could be more downside before a meaningful low appears.
Gazing at the 4-hr chart, this is my best guess:
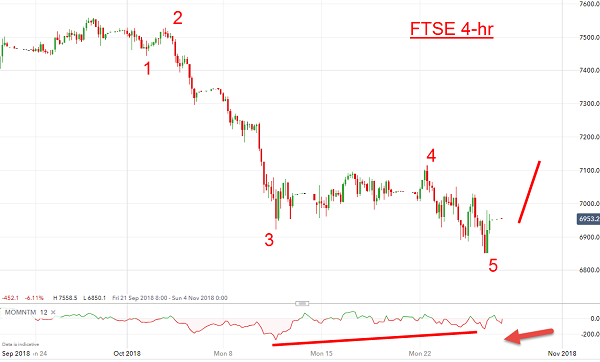
Source: interactive investor Past performance is not a guide to future performance
The latest plunge has a clear five-wave impulsive pattern with a magnificent momentum divergence at the low which is highly suggestive of a rally phase ahead. Of course, wave 5 may not be complete.
The bottom line: This is a great place to take some profits on shorts if trading short term. For traders who are comfortable trading against the major trend (down), going long carries a low risk (to the wave 5 low).
Under very favourable conditions (such as the Fed announcing a go-slow on its Quantitative Tightening), a wave 2 rally to the 7,200 area is likely.
And with a following wind, a target of 7,400 for the wave 2 high is not out of the question.
Once again, this would be a very contrarian near-term outcome.
John Burford is the author of the definitive text on his trading method, Tramline Trading. He is also a freelance contributor and not a direct employee of interactive investor.
These articles are provided for information purposes only. Occasionally, an opinion about whether to buy or sell a specific investment may be provided by third parties. The content is not intended to be a personal recommendation to buy or sell any financial instrument or product, or to adopt any investment strategy as it is not provided based on an assessment of your investing knowledge and experience, your financial situation or your investment objectives. The value of your investments, and the income derived from them, may go down as well as up. You may not get back all the money that you invest. The investments referred to in this article may not be suitable for all investors, and if in doubt, an investor should seek advice from a qualified investment adviser.
Full performance can be found on the company or index summary page on the interactive investor website. Simply click on the company's or index name highlighted in the article.
Disclosure
We use a combination of fundamental and technical analysis in forming our view as to the valuation and prospects of an investment. Where relevant we have set out those particular matters we think are important in the above article, but further detail can be found here.
Please note that our article on this investment should not be considered to be a regular publication.
Details of all recommendations issued by ii during the previous 12-month period can be found here.
ii adheres to a strict code of conduct. Contributors may hold shares or have other interests in companies included in these portfolios, which could create a conflict of interests. Contributors intending to write about any financial instruments in which they have an interest are required to disclose such interest to ii and in the article itself. ii will at all times consider whether such interest impairs the objectivity of the recommendation.
In addition, individuals involved in the production of investment articles are subject to a personal account dealing restriction, which prevents them from placing a transaction in the specified instrument(s) for a period before and for five working days after such publication. This is to avoid personal interests conflicting with the interests of the recipients of those investment articles.