Chart of the week: Is FTSE 100 about to do this?
Investors pray for a post Credit Crunch-style V-shaped recovery. Will history repeat itself?
30th March 2020 10:36
by John Burford from interactive investor
Investors pray for a post Credit Crunch-style V-shaped recovery. Will history repeat itself?

Was that a Dead Cat Bounce in the FTSE?
Two weeks ago, I offered my continued bearish outlook for the FTSE 100 for this year. It had crashed to the 5,570 area and this is what I wrote:
“At the current 50% level (around 5,570), we could see a bounce of some sort and then a further decline to the 5,000 area before any meaningful support can emerge.”
And that is precisely how it is playing out, with a dip to the 4,800 low last Monday and then a decent bounce to Thursday’s high at 5,800 (a gain of 20%). So far, so good.
But is that bounce one of the Dead Cat variety? Or is it the “V” shaped recovery much prayed-for by investors who are staying the course? They are looking back wistfully to March 2009 when the V-shaped recovery got under way following the Credit Crunch. Will history repeat?
Bullish-inclined investors were cheered last week by the tsunami of ‘support’ offered to consumers, employers, employees and companies by central banks and governments of the US and UK. And many believe the worst is over. But with credit agencies already starting to downgrade UK sovereign debt, the race to the bottom is now on.
Future interest payments will be an even more significant chunk of government outlays and will herald in a ratcheting of huge tax rises – always a dead weight on any economy. That at a time when the benefits system will be under great strain of spiking unemployment claims.
Notably absent from the recipients of this enforced taxpayer largesse were swathes of the self-employed. That could spell trouble ahead. Also, the EU has been in turmoil trying to figure out how it can get around the fiscal rules that Germany still insists it stick to. I expect to see fights break out in violent encounters in Brussels (and Strasburg?). The EU is at yet another crunch moment.
But will all of that ‘support’ restore confidence in the coronavirus-transformed economies? The bulls I read certainly believe so. They are unable to grasp that the world has changed. They believe that when this virus thing is over, people will resume their profligate spending habits of yore and share valuations can resume their sky-high levels. A reminder: Hope is not a reliable investment strategy.
I have a different take. We are in a severe bear market now after 11 years of debt-fuelled consumption. But, suddenly, consumers are being forced to examine their spending habits during these lockdowns and come face-to-face with the realities of their severely reduced budgets. Luxuries will become ever harder to justify.
In fact, most recent US data shows consumers are spending significantly less and saving more, just as you would expect ahead of a major economic slowdown.
Last year’s complacency (“stocks and real estate can only go up”) is being replaced by fear (“Blimey! Stocks are going down!”). And fear is no friend of the stock market.
And it appears we are heading for a Double Whammy – huge tax rises to inhibit the economy and social fear to depress stock valuations.
So, let’s get to the chart and see where we are:
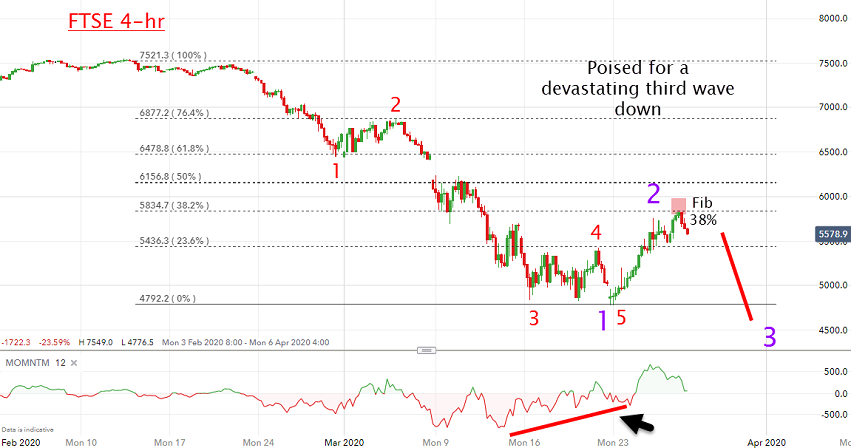
Source: interactive investor Past performance is not a guide to future performance
At last week’s 5,800 high, we should have attained the top of wave 2 and, if so, a devastating wave 3 down looms. We could possibly see one more small push to perhaps the 6,150 area (edge of gap), but I place that at lower odds.
A break of the 4,800 low on 23 March would help confirm my third wave down thesis. I can see a test of the 3,500 area on this leg (the 2003 and 2009 lows).
For more information about Tramline Traders, or to take a three-week free trial, go to www.tramlinetraders.com.
John Burford is the author of the definitive text on his trading method, Tramline Trading. He is also a freelance contributor and not a direct employee of interactive investor.
These articles are provided for information purposes only. Occasionally, an opinion about whether to buy or sell a specific investment may be provided by third parties. The content is not intended to be a personal recommendation to buy or sell any financial instrument or product, or to adopt any investment strategy as it is not provided based on an assessment of your investing knowledge and experience, your financial situation or your investment objectives. The value of your investments, and the income derived from them, may go down as well as up. You may not get back all the money that you invest. The investments referred to in this article may not be suitable for all investors, and if in doubt, an investor should seek advice from a qualified investment adviser.
Full performance can be found on the company or index summary page on the interactive investor website. Simply click on the company's or index name highlighted in the article.
Disclosure
We use a combination of fundamental and technical analysis in forming our view as to the valuation and prospects of an investment. Where relevant we have set out those particular matters we think are important in the above article, but further detail can be found here.
Please note that our article on this investment should not be considered to be a regular publication.
Details of all recommendations issued by ii during the previous 12-month period can be found here.
ii adheres to a strict code of conduct. Contributors may hold shares or have other interests in companies included in these portfolios, which could create a conflict of interests. Contributors intending to write about any financial instruments in which they have an interest are required to disclose such interest to ii and in the article itself. ii will at all times consider whether such interest impairs the objectivity of the recommendation.
In addition, individuals involved in the production of investment articles are subject to a personal account dealing restriction, which prevents them from placing a transaction in the specified instrument(s) for a period before and for five working days after such publication. This is to avoid personal interests conflicting with the interests of the recipients of those investment articles.