Chart of the week: A FTSE 100 bank trade
4th December 2017 11:50
by John Burford from interactive investor
Standard Chartered still in major bear trend
Regular readers know that I favour trades that I believe have a low risk of initial loss. In general, that means I look for rallies to short (or exit longs) and dips to buy (or cover shorts). But sometimes, a sharp break of a line of support/resistance will induce me to break my rule and sell a decline and buy a rally.
Last week's chart on was a case in point:
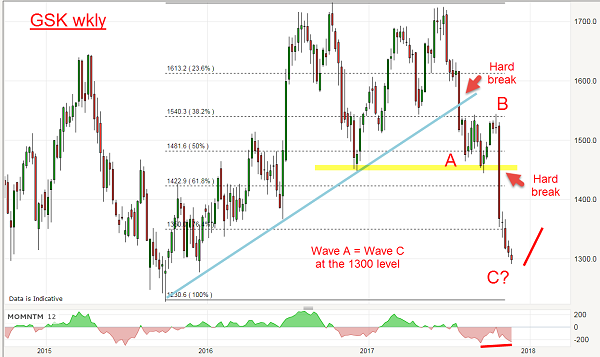
The hard break of the major blue trendline and of the yellow support zone were clear shorting signals.
But these hard breaks often result in snap-back rallies that can take you out of your position on your protective buy stops, subjecting these types of trades potentially at a high initial risk of loss.
For most traders, I recommend the safer former approach.
And here is a great example of this low risk approach in - a stock I have been following here for some time (and on which I have been consistently bearish).
And this is the reason on the weekly chart:
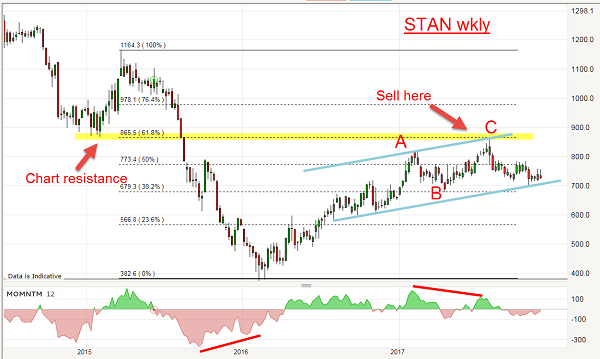
The shares were in a persistent decline to the February 2016 low which was marked by a huge momentum divergence (red bar) - a clear sign to expect a good-sized relief rally, which duly materialized.
Note the slope of the rally in 2017 was far weaker than the slope of the previous decline - the sure sign of a counter-trend relief move, rather than a new strong bull market.
Traders who recognised this were prepared for a major turn back down when the C wave topped. And the point where it topped was a dramatic demonstration of the power of market memory and of the Fibonacci sequence.
In fact, the rally carried (in a clear three counter-trend waves up) to the precise Fibonacci 62% retrace of the previous major wave down. And that was also the point of the 2015 low (these points are usually points of chart resistance. Note that the C wave high of August 31 at the 860p level was set 2½ years after that low - a colossal feat of market memory! (Yes, markets do have memories - and long ones at that).
A short trade at around the 860p level could be protected by a very close stop loss, giving us a very low risk trade.
And from that high, the market has declined to the current 730p level. But were there any other low-risk trades on offer on the decline?
Here is the daily chart of recent action off the C wave high at 860:
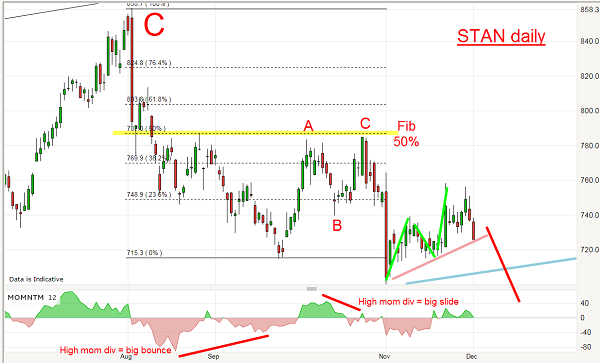
The decline has been pretty orderly, but when a low was put in on 25 September at 715p on a huge momentum divergence, I knew a decent relief rally was in store, hopefully in a three wave A-B-C pattern to either the most favoured Fibonacci 50% or 62% levels. I would be looking to enter new short trades there.
As it turned out, that was entirely the correct diagnosis and the C wave terminated at the 50% level again on a strong momentum divergence (which again presaged a sharp decline). Remember, my rule is the larger the divergence at turns, the sharper the move. That was an excellent low-risk opportunity to short again at the 780p level.
Last month, the shares dipped to the 697p level and are currently in an A-B-C relief pattern that has carried to the Fibonacci 62% retrace of the move off the C wave high on the above chart. That was another excellent low-risk shorting opportunity at the 750p level.
To sum up: we have had at least three excellent low-risk shorting opportunities since August 31 - at the 860, 780 and 750 levels. All are in profit to date.
My best guess is that the shares will continue lower after perhaps a small bounce, and a break of the lower blue tramline in the 700p area would really knock STAN for six.
This article is for information and discussion purposes only and does not form a recommendation to invest or otherwise. The value of an investment may fall. The investments referred to in this article may not be suitable for all investors, and if in doubt, an investor should seek advice from a qualified investment adviser.
These articles are provided for information purposes only. Occasionally, an opinion about whether to buy or sell a specific investment may be provided by third parties. The content is not intended to be a personal recommendation to buy or sell any financial instrument or product, or to adopt any investment strategy as it is not provided based on an assessment of your investing knowledge and experience, your financial situation or your investment objectives. The value of your investments, and the income derived from them, may go down as well as up. You may not get back all the money that you invest. The investments referred to in this article may not be suitable for all investors, and if in doubt, an investor should seek advice from a qualified investment adviser.
Full performance can be found on the company or index summary page on the interactive investor website. Simply click on the company's or index name highlighted in the article.
Disclosure
We use a combination of fundamental and technical analysis in forming our view as to the valuation and prospects of an investment. Where relevant we have set out those particular matters we think are important in the above article, but further detail can be found here.
Please note that our article on this investment should not be considered to be a regular publication.
Details of all recommendations issued by ii during the previous 12-month period can be found here.
ii adheres to a strict code of conduct. Contributors may hold shares or have other interests in companies included in these portfolios, which could create a conflict of interests. Contributors intending to write about any financial instruments in which they have an interest are required to disclose such interest to ii and in the article itself. ii will at all times consider whether such interest impairs the objectivity of the recommendation.
In addition, individuals involved in the production of investment articles are subject to a personal account dealing restriction, which prevents them from placing a transaction in the specified instrument(s) for a period before and for five working days after such publication. This is to avoid personal interests conflicting with the interests of the recipients of those investment articles.