Chart of the week: the FTSE is at a crossroads (again)
The index has surged from vaccine news, but trouble could be brewing.
7th December 2020 12:41
by John Burford from interactive investor
The index has surged ahead on the back of vaccine positivity, but our chartist wonders if trouble could be brewing.

I believe we are now at a major crossroads in the FTSE 100 index.
On the one hand, the last few days have seen strong advances, especially in the previously beaten-down major issues such as BT (LSE:BT.A), BP (LSE:BP.) and UK Banks. These have seen large percentage gains since I recommended them here from early October.
But I also see signs of trouble brewing. And one of the flashing warning signs is the new-found exuberance among market commentators for buying ‘cheap’ UK shares. Markets follow sentiment – and the surge in positive sentiment recently helped create the strong gains.
Of course, they are seeing light at the end of the pandemic tunnel with vaccines being rolled out this week. A miracle indeed. But will that translate into miraculous stock advances?
But for the few of us that believe the appearance of effective vaccines in record time represents a peak in optimism, and not the start of a ‘new era’ of economic growth and a major boost to share prices, caution is now advised.
Judging market mood
It is a well-established fact that when everyone believes shares can only go up from here, sudden disappointments are often not far away. As the trader Joe Granville once said:
“When everyone believes it is certain, it is certainly wrong”.
One litmus test for the mood of the market that I regularly use is to scan headlines of articles in the financial press. One such guru I follow is now advising ‘loading up on UK shares even with Brexit risks’. He quotes November as a fabulous month for shares – and it was, and the natural reaction is to feel positive for further gains (the recency bias).
But this is precisely the time, when there is so much confidence in a hugely bullish future, that genuine contrarians look for reasons to trade against that view. Getting it right can often reap huge rewards.
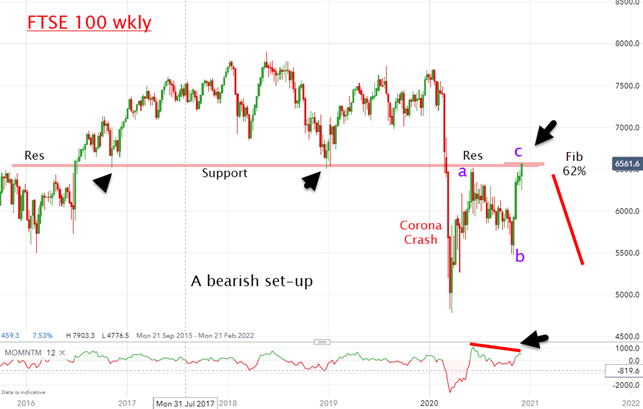
Here is the weekly FTSE chart that shows some reasons why I am advising caution.

Source: interactive investor. Past performance is not a guide to future performance.
Bear or bull signals?
My pink horizontal bar at around 6,600 separates the areas of resistance and support from at least 2016 – a goodly long period that establishes it as a reliable guide for near-term action. The Coronavirus crash in March sent it well below that zone, and the recovery since then has been in a clear three-wave pattern, which is always corrective to the one larger trend (down).
And now it is again testing that zone of resistance, it has retraced a Fibonacci 62% of the March Coronavirus wave – which is a typical target for a reversal. Note the large momentum divergence as the ‘c’ wave hits the resistance zone, as the buying pressure is actually weakening in the face of the current bullish exuberance. That is a bearish signal.
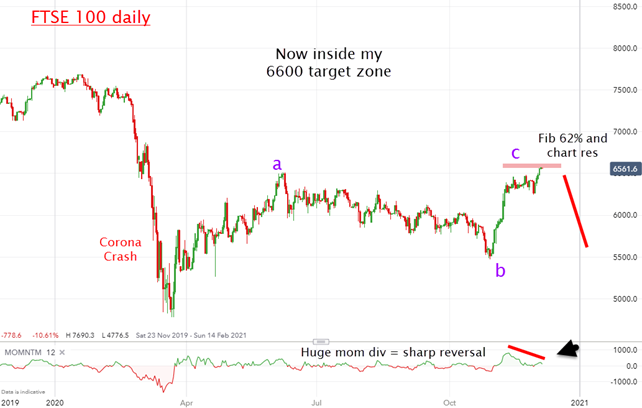
And here is a close-up on the daily chart:

Source: interactive investor. Past performance is not a guide to future performance.
The surge off the ‘b’ wave low since November is certainly strong – and that has given birth to the current bullish enthusiasm. But now the momentum divergence on this scale is even more stark, as it lies in the 6,600 target zone.
Of course, shares could move higher above the 6,600 mark, but it would take a huge buying force to do it – and a succession of more miracles!
In the background are the rising bond yields that are quietly undermining the bull case for shares. And with record high debt levels everywhere you look, rising yields could severely damage balance sheets of highly indebted companies (there are many) – and kill prospects for growth.
But there is lots to be cautious about, absent miracles.
For more information about Tramline Traders, or to take a three-week free trial, go to www.tramlinetraders.com.
John Burford is the author of the definitive text on his trading method, Tramline Trading. He is also a freelance contributor and not a direct employee of interactive investor.
These articles are provided for information purposes only. Occasionally, an opinion about whether to buy or sell a specific investment may be provided by third parties. The content is not intended to be a personal recommendation to buy or sell any financial instrument or product, or to adopt any investment strategy as it is not provided based on an assessment of your investing knowledge and experience, your financial situation or your investment objectives. The value of your investments, and the income derived from them, may go down as well as up. You may not get back all the money that you invest. The investments referred to in this article may not be suitable for all investors, and if in doubt, an investor should seek advice from a qualified investment adviser.
Full performance can be found on the company or index summary page on the interactive investor website. Simply click on the company's or index name highlighted in the article.
Disclosure
We use a combination of fundamental and technical analysis in forming our view as to the valuation and prospects of an investment. Where relevant we have set out those particular matters we think are important in the above article, but further detail can be found here.
Please note that our article on this investment should not be considered to be a regular publication.
Details of all recommendations issued by ii during the previous 12-month period can be found here.
ii adheres to a strict code of conduct. Contributors may hold shares or have other interests in companies included in these portfolios, which could create a conflict of interests. Contributors intending to write about any financial instruments in which they have an interest are required to disclose such interest to ii and in the article itself. ii will at all times consider whether such interest impairs the objectivity of the recommendation.
In addition, individuals involved in the production of investment articles are subject to a personal account dealing restriction, which prevents them from placing a transaction in the specified instrument(s) for a period before and for five working days after such publication. This is to avoid personal interests conflicting with the interests of the recipients of those investment articles.