Chart of the week: History says these shares have bottomed
After a string of successful trades, this could be another genuine opportunity at just the right time.
28th October 2019 11:29
by John Burford from interactive investor
After a string of successful trades, this could be another genuine opportunity at just the right time.

Can Alcoa recover?
I have found quite a few bombed-out shares for COTW recently - five of my last seven are Barclays (LSE:BARC), BT (LSE:BT.A), British American Tobacco (LSE:BATS), Metro Bank (LSE:MTRO) and General Electric (NYSE:GE). They are all on my Buy Low/Sell High list and all are in profit. I believe I can now add Alcoa (NYSE:AA) to it.
Incidentally, the sixth of my last seven COTWs covered McDonald's (NYSE:MCD), which is on my Sell High/Buy Low list – and it too is in profit on short sales.
It is one thing to find a severe under-performer - that involves little skill. But it is another to identify a genuine opportunity at the right time. It is no good getting in too early (or too late!). And gut feel is not a good reliable timing method.
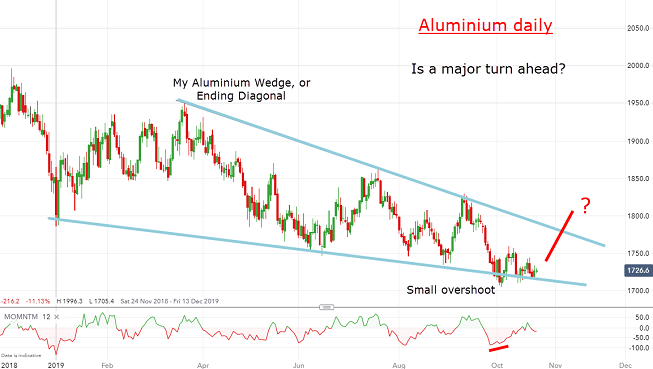
Alcoa is a major producer of aluminium. Its fortunes are tied hand-in-hand to the market price of the metal which has been in a severe decline in recent months.
Here it is on the daily chart:
Source: interactive investor Past performance is not a guide to future performance
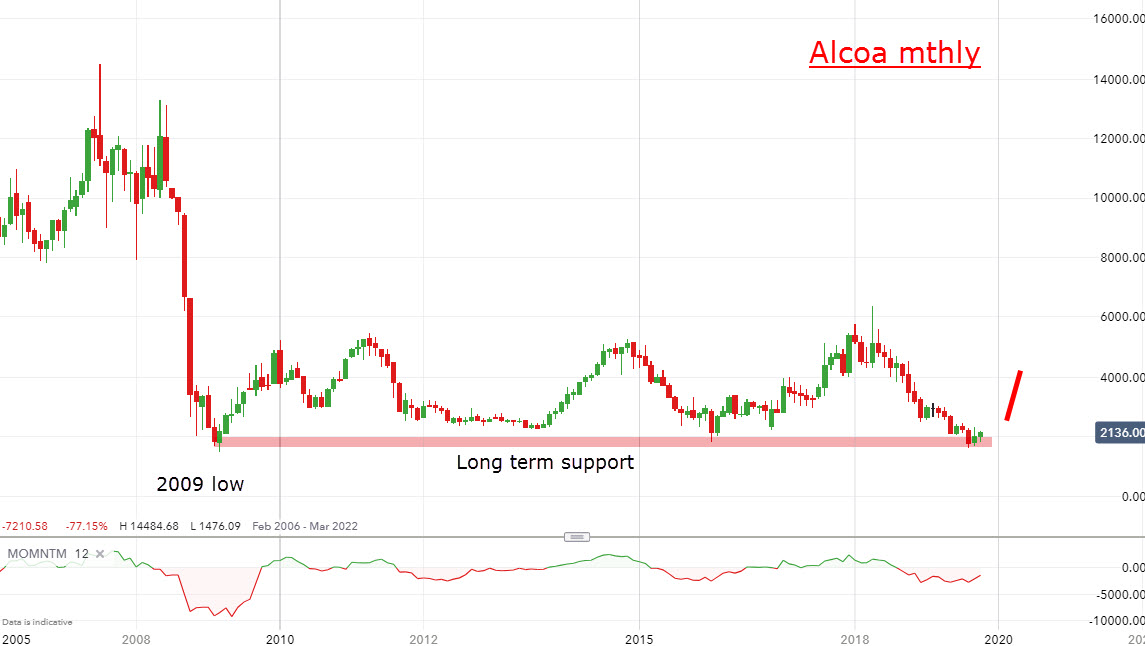
But is this picture showing a reversal is at hand? I have a classic Wedge/Ending Diagonal with the 3 October low making a small 'overshoot' that can often indicate buying exhaustion after a lengthy decline. If so, then Alcoa should follow suit. Here is the long-term monthly chart:
Source: interactive investor Past performance is not a guide to future performance
In fact, the shares have been caught in a well-defined 10-year range between the $20 and $50 areas, and the recent low has dipped to the lower zone which is a 10-year support area. If history is to repeat, the shares should now stage a recovery of some sort.
Source: interactive investor Past performance is not a guide to future performance
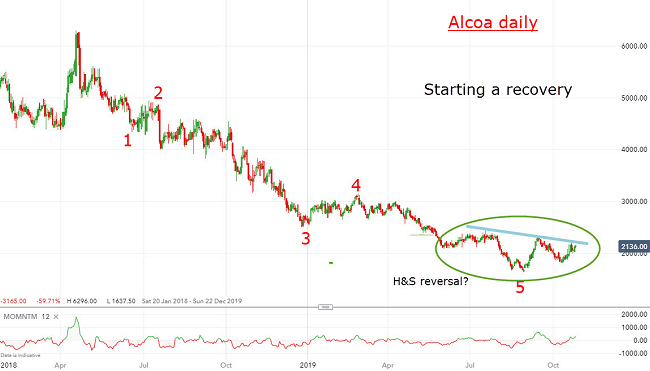
Another clue is that this is the decline off the April 2018 high at $63 which I can label as five waves. But note the form of the latest action at the end of the fifth wave. It closely resembles a Head and Shoulders reversal pattern. I have drawn in the 'neckline' in blue which a push above it at the $22.50 region would confirm.
It is possible that wave 5 has not completed, but already it does possess its own five sub-waves making it very likely the low is in or very close. And I have a momentum divergence working in our favour, so my best guess is that the low is in and odds favour a bull run with my first target around the $31 zone. Higher potential exists to the $40 mark.
For more information about Tramline Traders, or to take a three-week free trial, go to www.tramlinetraders.com.
John Burford is the author of the definitive text on his trading method, Tramline Trading. He is also a freelance contributor and not a direct employee of interactive investor.
These articles are provided for information purposes only. Occasionally, an opinion about whether to buy or sell a specific investment may be provided by third parties. The content is not intended to be a personal recommendation to buy or sell any financial instrument or product, or to adopt any investment strategy as it is not provided based on an assessment of your investing knowledge and experience, your financial situation or your investment objectives. The value of your investments, and the income derived from them, may go down as well as up. You may not get back all the money that you invest. The investments referred to in this article may not be suitable for all investors, and if in doubt, an investor should seek advice from a qualified investment adviser.
Full performance can be found on the company or index summary page on the interactive investor website. Simply click on the company's or index name highlighted in the article.
Disclosure
We use a combination of fundamental and technical analysis in forming our view as to the valuation and prospects of an investment. Where relevant we have set out those particular matters we think are important in the above article, but further detail can be found here.
Please note that our article on this investment should not be considered to be a regular publication.
Details of all recommendations issued by ii during the previous 12-month period can be found here.
ii adheres to a strict code of conduct. Contributors may hold shares or have other interests in companies included in these portfolios, which could create a conflict of interests. Contributors intending to write about any financial instruments in which they have an interest are required to disclose such interest to ii and in the article itself. ii will at all times consider whether such interest impairs the objectivity of the recommendation.
In addition, individuals involved in the production of investment articles are subject to a personal account dealing restriction, which prevents them from placing a transaction in the specified instrument(s) for a period before and for five working days after such publication. This is to avoid personal interests conflicting with the interests of the recipients of those investment articles.