Chart of the week: How IBM missed the tech boom
Despite the tech boom, IBM shares have gone backwards. Analyst John Burford charts the performance.
27th July 2020 11:46
by John Burford from interactive investor
Despite the tech boom, IBM shares have gone backwards. Analyst John Burford charts the performance.

I am old enough to remember when International Business Machines (NYSE:IBM) was a hot growth stock. It was in fact a member of the famous ‘Nifty Fifty’ of the 1960s which were considered then to be ‘one decision’ stocks. And that decision was to buy (and never sell). Does that remind you of any sector today? Ah yes, some things never change in the investment world.
And the denouement for the Nifty Fifty (a crash in the 1980s) will be mirrored in today’s hottest sectors. The only question is when.
I have a soft spot for IBM as in the 1960s I worked on the cutting-edge lumbering IBM 360 mainframe magnetic tape computer housed in a large air-conditioned room and handed decks of punched cards (using Fortran language) to the clean operators in much the same way as Amazon deliveries are set outside your door today with no human contact. As I say, some things never change.
But I digress. Today, IBM has matured into an income stock. But despite the huge capital share growth in its rivals, IBM has really gone nowhere in recent years. Here is the revealing seven-year chart.
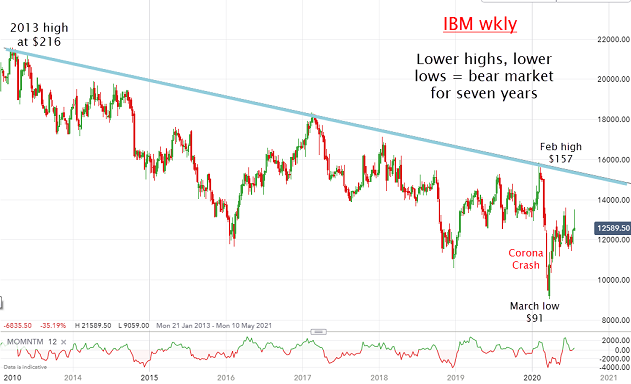
Source: interactive investor. Past performance is not a guide to future performance.
From the 2013 high at $216, the trend has been relentlessly down. With lower highs and lower lows, it satisfies the very definition of a bear market. So why are long-term investors buying it? Surely it cannot be for the hoped-for capital appreciation as there has been none over a long time frame.
In fact over the last seven years, at the current $125, it has mostly traded above that mark. That means most investors buying in the last seven years have seen a capital loss. Hmm.
And the March Corona Crash low in the $90s was last seen at the lows of the 2009 financial crisis. For a share that is firmly in the tech sector, that is some achievement.
Now compare this dismal performance with a close competitor (in the cloud computing sector at least) – Microsoft (NASDAQ:MSFT). This is another US giant but its price performance is on another planet.
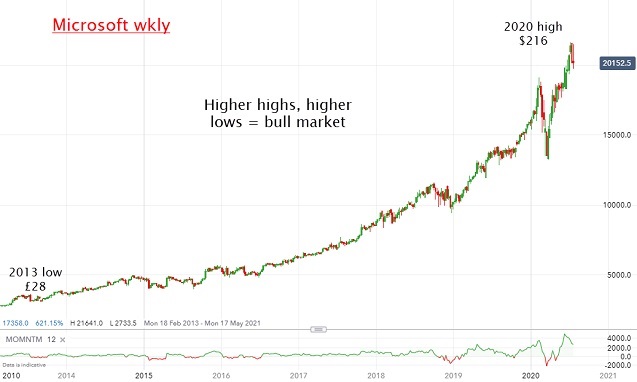
Source: interactive investor. Past performance is not a guide to future performance.
With the tech-laden Nasdaq in a manic exponential surge, poor old IBM is stuck to the floor. So if it cannot generate upside given this hurricane-force following wind, what will happen when the Nasdaq does finally flame out?
It doesn’t bear thinking about (pun intended).
For more information about Tramline Traders, or to take a three-week free trial, go to www.tramlinetraders.com.
John Burford is the author of the definitive text on his trading method, Tramline Trading. He is also a freelance contributor and not a direct employee of interactive investor.
These articles are provided for information purposes only. Occasionally, an opinion about whether to buy or sell a specific investment may be provided by third parties. The content is not intended to be a personal recommendation to buy or sell any financial instrument or product, or to adopt any investment strategy as it is not provided based on an assessment of your investing knowledge and experience, your financial situation or your investment objectives. The value of your investments, and the income derived from them, may go down as well as up. You may not get back all the money that you invest. The investments referred to in this article may not be suitable for all investors, and if in doubt, an investor should seek advice from a qualified investment adviser.
Full performance can be found on the company or index summary page on the interactive investor website. Simply click on the company's or index name highlighted in the article.
Disclosure
We use a combination of fundamental and technical analysis in forming our view as to the valuation and prospects of an investment. Where relevant we have set out those particular matters we think are important in the above article, but further detail can be found here.
Please note that our article on this investment should not be considered to be a regular publication.
Details of all recommendations issued by ii during the previous 12-month period can be found here.
ii adheres to a strict code of conduct. Contributors may hold shares or have other interests in companies included in these portfolios, which could create a conflict of interests. Contributors intending to write about any financial instruments in which they have an interest are required to disclose such interest to ii and in the article itself. ii will at all times consider whether such interest impairs the objectivity of the recommendation.
In addition, individuals involved in the production of investment articles are subject to a personal account dealing restriction, which prevents them from placing a transaction in the specified instrument(s) for a period before and for five working days after such publication. This is to avoid personal interests conflicting with the interests of the recipients of those investment articles.