Chart of the week: how long can Apple stock defy gravity?
As positive vaccine news revives markets, our technical analyst gives his view on playing the recovery.
23rd November 2020 13:56
by John Burford from interactive investor
As positive vaccine news revives markets, our technical analyst gives his view on playing the recovery.
As one of the leaders of the major US stock indexes, Apple (NASDAQ:AAPL) is the lodestar that guides the main trends. This is remarkable for a mobile phone operation. A few decades ago, it was famously said that what was good for General Motors was good for the USA. The universal trend towards miniaturisation is well reflected in the move from cars to handheld phones.
When I covered Apple on 7 September – Is it time to take Apple profits? - I laid out my case that the shares were probably reaching a peak in a buying climax. Its market cap had reached an astonishing 90% of the entire cap of the entire Russell 2000 index, and by this measure at least it was wildly overvalued.
But, as former Federal Reserve chairman Alan Greenspan discovered in 1996, merely uttering the now infamous “irrational exuberance” judgement on the Nasdaq and the hot internet stocks, the madness can continue for years afterwards – in that case until the top in 2000, an astonishing four years later.
And that could certainly occur in today’s mania, which could extend in a similar fashion. So, with that proviso, I did stick my neck out in September – but, so far, the shares have not advanced, and taking at least some profit is being justified.
This is the updated chart I showed last time:
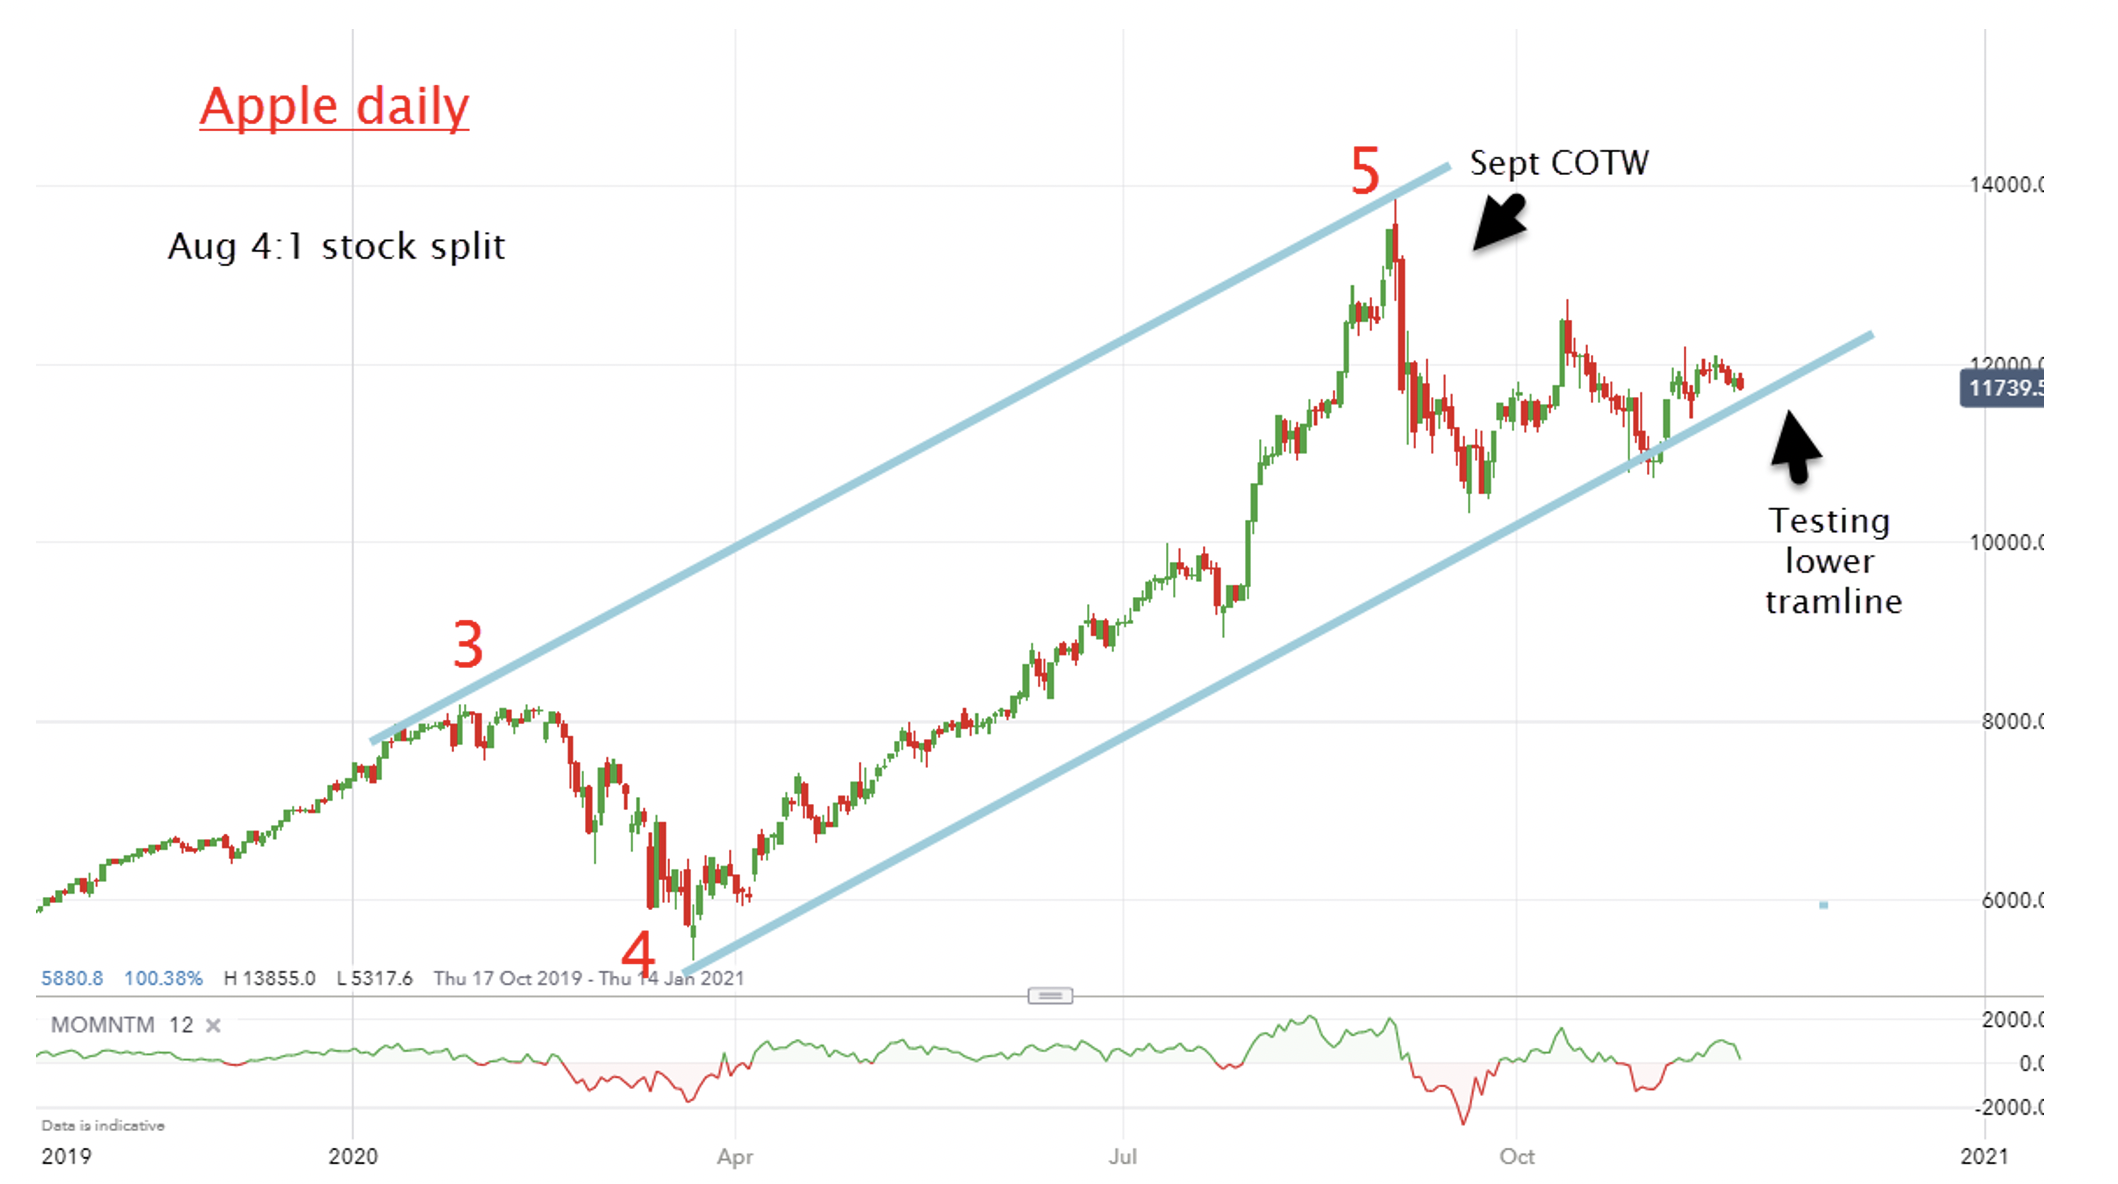
Source: interactive investor. Past performance is not a guide to future performance.
The share price has been adjusted for the 4:1 stock split in late August. Note that this event marked the top so far at just under $140. It trades currently at around $117. I have found over the years that an event such as a stock split or the inclusion/deletion of a share from an index often coincides with a trend change.
- Tesla and Apple top list of bestselling stocks
- Take control of your retirement planning with our award-winning, low-cost Self-Invested Personal Pension (SIPP)
Of course, these date-specific events are well flagged ahead of time. For the host of index funds that have to buy every new index inclusion when it appears, savvy traders bid the stock up beforehand and then take their profits soon after it appears in the index in a “pump and dump” operation.
Note the almost vertical rise in Apple’s share price in August when knowledge of the proposed stock split spread more widely. And then the sharp decline thereafter as they dumped their holdings.
So where are we now?
Since September, the shares have been swinging quite widely, with a rapid descent to the $104 level for a very substantial loss of 25% off the high. Did that shake the Apple tree enough to force long-term holders out? Since then it has made smaller swings – a sign of indecision.
I have a tentative blue trading channel working between the blue trendlines, with the market currently testing the support of the lower trendline. Any sharp break here would very likely confirm the late August top. But a renewed strong advance would likely lead to a possible test of the old high.
With such indecision and so much riding on the outcome, I am very comfortable with having some funds in the bank from my sales in early September. And I still have some shares in hand that would benefit from the bullish option being followed.
In terms of my general outlook, the news of several effective Covid vaccines last week was met with market gains. But with the end of lockdowns in sight, is this as good as it gets? Can market optimism stretch any higher? I ask because market tops occur when bullish sentiment reaches extremes – and we may be there right now.
For more information about Tramline Traders, or to take a three-week free trial, go to www.tramlinetraders.com.
John Burford is the author of the definitive text on his trading method, Tramline Trading. He is also a freelance contributor and not a direct employee of interactive investor.
These articles are provided for information purposes only. Occasionally, an opinion about whether to buy or sell a specific investment may be provided by third parties. The content is not intended to be a personal recommendation to buy or sell any financial instrument or product, or to adopt any investment strategy as it is not provided based on an assessment of your investing knowledge and experience, your financial situation or your investment objectives. The value of your investments, and the income derived from them, may go down as well as up. You may not get back all the money that you invest. The investments referred to in this article may not be suitable for all investors, and if in doubt, an investor should seek advice from a qualified investment adviser.
Full performance can be found on the company or index summary page on the interactive investor website. Simply click on the company's or index name highlighted in the article.
Disclosure
We use a combination of fundamental and technical analysis in forming our view as to the valuation and prospects of an investment. Where relevant we have set out those particular matters we think are important in the above article, but further detail can be found here.
Please note that our article on this investment should not be considered to be a regular publication.
Details of all recommendations issued by ii during the previous 12-month period can be found here.
ii adheres to a strict code of conduct. Contributors may hold shares or have other interests in companies included in these portfolios, which could create a conflict of interests. Contributors intending to write about any financial instruments in which they have an interest are required to disclose such interest to ii and in the article itself. ii will at all times consider whether such interest impairs the objectivity of the recommendation.
In addition, individuals involved in the production of investment articles are subject to a personal account dealing restriction, which prevents them from placing a transaction in the specified instrument(s) for a period before and for five working days after such publication. This is to avoid personal interests conflicting with the interests of the recipients of those investment articles.