Chart of the week: is Japan about to rise again?
6th September 2021 12:35
by John Burford from interactive investor
Our technical analysis expert takes a close look at the candles for Japan’s leading index, the Nikkei 225.

Asian stocks have been lagging the US for some months and nowhere is this more prominent than in Japan, where the Nikkei 225 index is off by 12% from its February all-time high (ATH). Meanwhile, the S&P has gained by 20% in this period.
It is generally thought that Japan has not handled the pandemic well and consumer sentiment is low (witness the local hostility to the Olympic Games). Combine that with the general sluggish economic performance and you have a recipe for a weaker stock market.
But with the change in leadership away from 'Abenomics' – and another one looming – has the scene been set for a renewed upswing in the land of the rising sun?
- Japan’s stock market: the basics every investor should know
- Open an ISA with interactive investor. Click here to find out how
And remember, the Bank of Japan (BoJ) is still buying exchange-traded funds (ETFs) and Japanese Government Bonds (JGBs) hand over fist and are unlikely to ease off with sentiment so low. The new leadership is more likely to augment that programme with positive results for stocks.
Incidentally, UK investors have generally shied away from non-UK/US assets, but could expand their horizon to Asia where I believe Japan offers value at present. The Japan 225 index offers an ETF that is easily tradable.
So, why do I believe Japan is set to rise again now? Here is the long-term monthly chart where I identified a likely upside reversal a month ago:
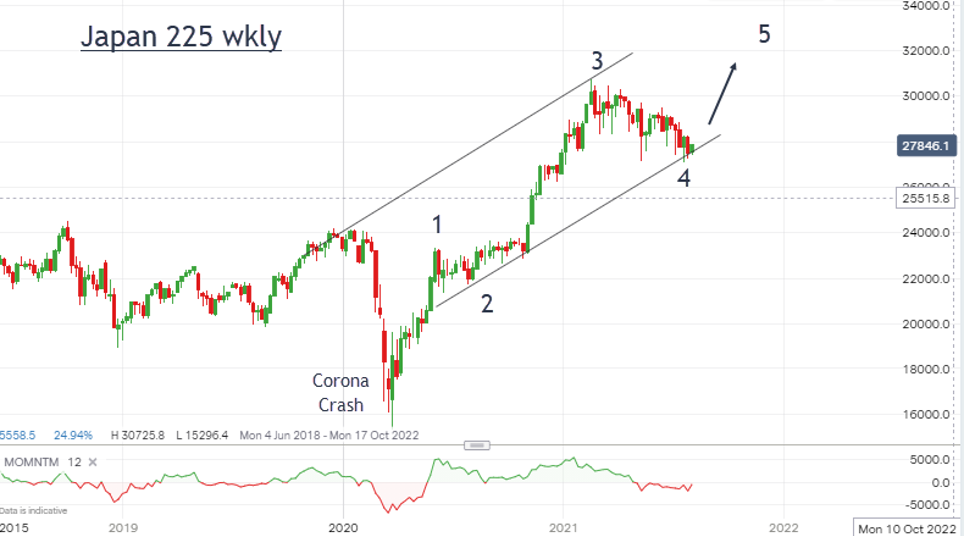
Past performance is not a guide to future performance.
The market had descended right to test the major tramline of support and odds supported an upside reversal from that point.
Here is a close-up of recent action on the daily:
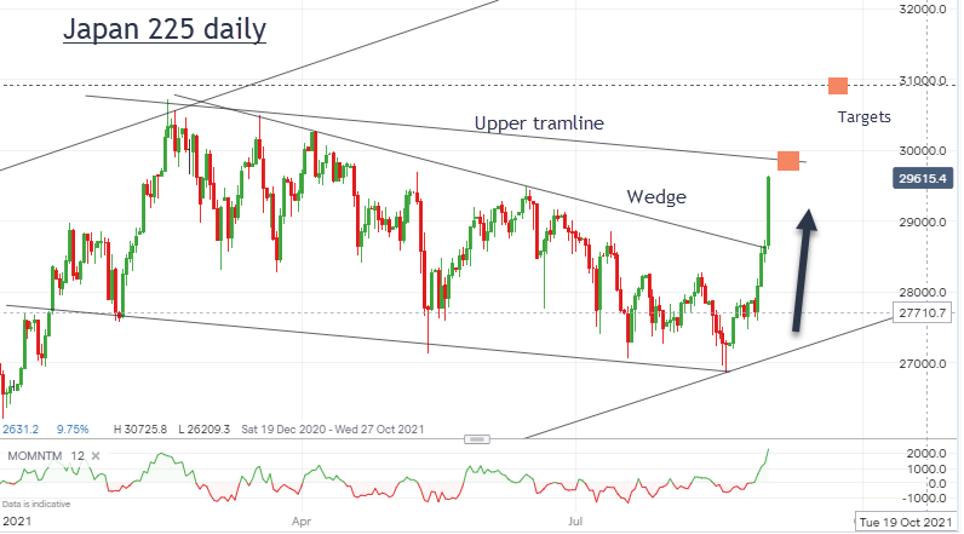
Past performance is not a guide to future performance.
On 20 August, the market bounced off the point where it met two major lines of support; first from the lower wedge line and then from the major lower tramline on the weekly. And by virtue of a momentum divergence at the low, it was able to rally very powerfully to begin wave 5 up.
Already it is up over 10% off the 20 August low. No doubt the strength of the rally was partly the result of a massive short squeeze of institutions who were kept off-guard by the 'shock' political developments. But it was well flagged by my earlier chart analysis – here it is in detail.
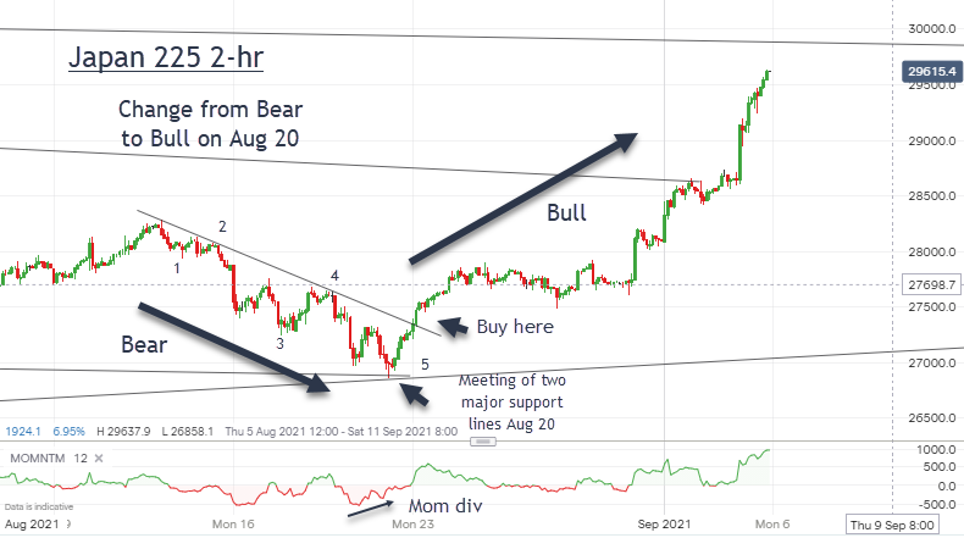
Past performance is not a guide to future performance.
Last week, I had a note on the Japan 225 in my video alerting viewers to this possibility that the trend had changed on 20 August.
This morning, the main target at the round number 30,000 level has been achieved.
Usually, there is some pause at least as a major round number target is hit. But if not, I have the next target around 31,100 in my sights. And after that, the old 1990 ATH at 39,000 heaves into view.
This promises to be a very exciting ride.
John Burford is the author of the definitive text on his trading method, Tramline Trading. He is also a freelance contributor and not a direct employee of interactive investor.
These articles are provided for information purposes only. Occasionally, an opinion about whether to buy or sell a specific investment may be provided by third parties. The content is not intended to be a personal recommendation to buy or sell any financial instrument or product, or to adopt any investment strategy as it is not provided based on an assessment of your investing knowledge and experience, your financial situation or your investment objectives. The value of your investments, and the income derived from them, may go down as well as up. You may not get back all the money that you invest. The investments referred to in this article may not be suitable for all investors, and if in doubt, an investor should seek advice from a qualified investment adviser.
Full performance can be found on the company or index summary page on the interactive investor website. Simply click on the company's or index name highlighted in the article.
Disclosure
We use a combination of fundamental and technical analysis in forming our view as to the valuation and prospects of an investment. Where relevant we have set out those particular matters we think are important in the above article, but further detail can be found here.
Please note that our article on this investment should not be considered to be a regular publication.
Details of all recommendations issued by ii during the previous 12-month period can be found here.
ii adheres to a strict code of conduct. Contributors may hold shares or have other interests in companies included in these portfolios, which could create a conflict of interests. Contributors intending to write about any financial instruments in which they have an interest are required to disclose such interest to ii and in the article itself. ii will at all times consider whether such interest impairs the objectivity of the recommendation.
In addition, individuals involved in the production of investment articles are subject to a personal account dealing restriction, which prevents them from placing a transaction in the specified instrument(s) for a period before and for five working days after such publication. This is to avoid personal interests conflicting with the interests of the recipients of those investment articles.