Chart of the week: Lloyds Bank hits my first target – and then falls back
24th October 2022 15:15
by John Burford from interactive investor
Amid talk of a hard recession, analyst John Burford explains what his charts reveal about the possible future direction of this popular blue-chip stock.

We have seen huge movements in sterling and long-dated gilts in recent days (much covered elsewhere). Gilt yields approached the 4.5% range, but have since fallen back. On Black Monday (28 September), sterling reached the all-time low of $1.03 before snapping back. There was much talk of parity and under for the pound then. But as usual, that did not occur (at least not yet).
Many ascribed that final blast of weakness to the ill-fated expansionary ‘Trussonomics’. Not so. The bear trends were already well established months previously.
On the face of it, UK banks such as Lloyds Banking Group (LSE:LLOY) (last covered on 12 September) should benefit from higher mortgage rates as the profit margins have zoomed higher from the wafer-thin scrapings on offer when the bank rate was near the zero bound.
- Find out about: Trading Account | Share prices today | Top UK shares
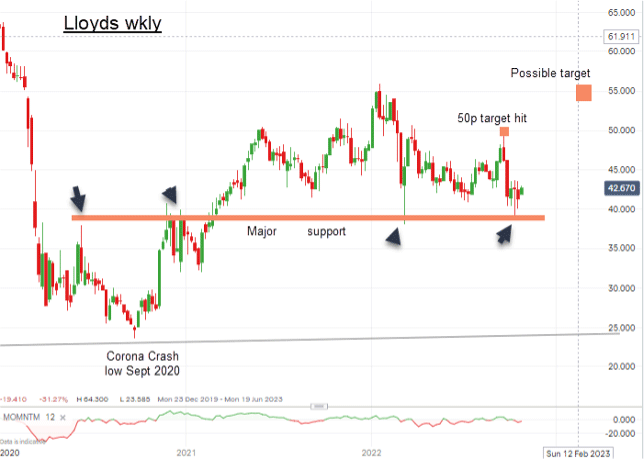
And that knee-jerk bullish reaction to Lloyds shares after my September post enabled my forecast for a 50p target to be met. This is what I wrote then: Provided this 45p low can hold, my first target is the 50p region with solid potential to reach my next target at the old high at 56p.
The shares were trading at the 46p level then and the up-move to the 50p target could not be sustained. Of course, wider margins on home loans are being countered by the drop-off in new purchase applications by first-time buyers.
The life of a banker is a see-saw one between low rates/high activity and high rates/depressed activity.
- UK bank sector Q3 results season
- How will Hunt’s tax plans impact Lloyds and NatWest?
- Lloyds Bank analysis: hopes and fears for this stock
One other factor is the earnings from their holdings of gilts. Existing holdings have dropped in value (many bought during the low rate period when prices were high), while new purchases earn the higher yield.
But the overriding factor for banks is the state of the UK economy. In recessions, banks do not fare well – Lloyds dropped precipitously from 307p in 2007 to the all-time low under 20p in January 2008 during the credit crunch.
But, as always is the case, it is the market that front-runs the news and bank shares are good litmus tests for the economy. So, are they pointing lower anticipating the hard recession that many believe inevitable?

Past performance is not a guide to future performance.
On the weekly chart note that the dip to the 39p level took it for a test of the major long-term support (pink bar) on 10 October. It has moved higher since.
Only a sharp break below the 39p support level would tell me we are heading lower and a hard recession would appear likely. A move higher from here would decidedly confound the many bears and a decent short squeeze could accomplish that.
In the meantime, it appears the shares will flop to and fro for a while as the market assesses the economic policies of the new government.
It is highly doubtful that they will be expansive and tend towards the more austere side of the spectrum.
My secondary target was 56p and provided the 39p support level still holds, that is still a realistic ambition.
John Burford is a freelance contributor and not a direct employee of interactive investor.
These articles are provided for information purposes only. Occasionally, an opinion about whether to buy or sell a specific investment may be provided by third parties. The content is not intended to be a personal recommendation to buy or sell any financial instrument or product, or to adopt any investment strategy as it is not provided based on an assessment of your investing knowledge and experience, your financial situation or your investment objectives. The value of your investments, and the income derived from them, may go down as well as up. You may not get back all the money that you invest. The investments referred to in this article may not be suitable for all investors, and if in doubt, an investor should seek advice from a qualified investment adviser.
Full performance can be found on the company or index summary page on the interactive investor website. Simply click on the company's or index name highlighted in the article.
Disclosure
We use a combination of fundamental and technical analysis in forming our view as to the valuation and prospects of an investment. Where relevant we have set out those particular matters we think are important in the above article, but further detail can be found here.
Please note that our article on this investment should not be considered to be a regular publication.
Details of all recommendations issued by ii during the previous 12-month period can be found here.
ii adheres to a strict code of conduct. Contributors may hold shares or have other interests in companies included in these portfolios, which could create a conflict of interests. Contributors intending to write about any financial instruments in which they have an interest are required to disclose such interest to ii and in the article itself. ii will at all times consider whether such interest impairs the objectivity of the recommendation.
In addition, individuals involved in the production of investment articles are subject to a personal account dealing restriction, which prevents them from placing a transaction in the specified instrument(s) for a period before and for five working days after such publication. This is to avoid personal interests conflicting with the interests of the recipients of those investment articles.