Chart of the week: Is massive upside imminent?
Sector consolidation is underway, and this company could be involved. Chart signals are positive too.
15th July 2019 11:53
by John Burford from interactive investor
These shares have been in steady decline, but sector consolidation is underway, and this company could be involved. Chart signals are positive too.

Can Tenneco rise from the dead?
Tenneco (NYSE:TEN) is a major US car parts supplier that has seen its shares collapse in the great auto parts sector shake-out as the electric vehicle (EV) revolution motors on.
With far fewer parts to replace that in conventional petrol/diesel powered vehicles, the advent of EVs has exploded a mine under that sector.
The shares were once trading at over $70 two years ago, but cratered to a low of $8.60 last Thursday for a stunning loss of 88% in two years.
Just on that basis alone, I am considering putting it on my Buy Low/Sell High list. But I have other reasons to believe the shares can start a major rally phase from here or nearby. There is at least a swing trade available, or even an investment as it becomes a takeover candidate since consolidation in the sector appears assured.
One of the factors inducing the bearish sentiment is the high debt load, which is certainly a drag on profitability. But in its defence, there are many countries such as India, where the EV revolution will likely manifest much later than here and the USA. And these nations possess a lot of conventionally-powered vehicles.
Here are the charts I prepared last week for clients just before Friday's 10% surge.
This is the daily chart showing the move off the all-time high in 2017, with the latest move lower tracing out a clear ‘five down’ that is contained between my excellent tramline pair.
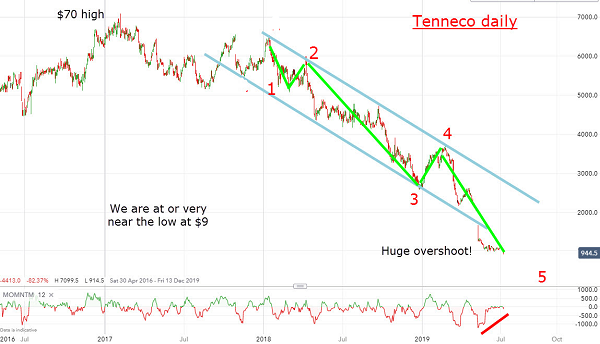
Source: interactive investor Past performance is not a guide to future performance
There are several points to note. First is the possible 'overshoot' reversal signal below the lower tramline that would be confirmed by a move back inside the trading channel. Overshoots are areas of selling exhaustion that often precede vigorous reversals.
Second is the large momentum divergence at last Thursday's low, which confirms selling pressure is about spent. Third is the fact the market is in the final fifth wave which is always an ending wave. Of course, I cannot say with certainty that this fifth wave has terminated, but it surely is near its end.
These factors point to one thing: an upside reversal is here or is nearby, and it is likely to be strong.
For additional clues, here is a close-up of the fifth wave:
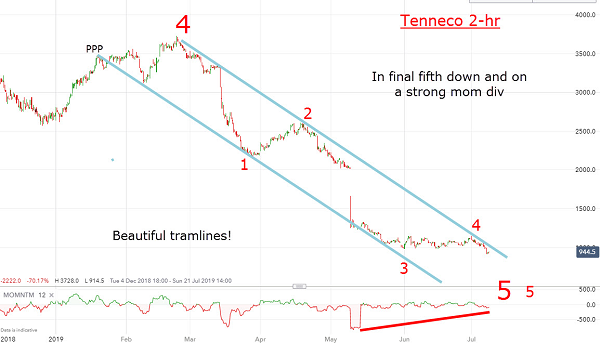
Source: interactive investor Past performance is not a guide to future performance
Again, I have a five-wave structure within another very good tramline pair with highly accurate touch points. And we are in the final fifth wave of that larger fifth wave – and, even on this scale, we have a huge momentum divergence.
The bottom line: we are at or very near a massive upside reversal. My first target is the open gap at the $15-$20 zone. If investors do smell a takeover, then the $35 region is certainly possible.
Already, deals are being proposed in this sector. Tower International has just received a bid $12 above its previous closing price of $18. Could something similar be in store for Tenneco?
For more information about Tramline Traders, or to take a three-week free trial, go to www.tramlinetraders.com.
John Burford is the author of the definitive text on his trading method, Tramline Trading. He is also a freelance contributor and not a direct employee of interactive investor.
These articles are provided for information purposes only. Occasionally, an opinion about whether to buy or sell a specific investment may be provided by third parties. The content is not intended to be a personal recommendation to buy or sell any financial instrument or product, or to adopt any investment strategy as it is not provided based on an assessment of your investing knowledge and experience, your financial situation or your investment objectives. The value of your investments, and the income derived from them, may go down as well as up. You may not get back all the money that you invest. The investments referred to in this article may not be suitable for all investors, and if in doubt, an investor should seek advice from a qualified investment adviser.
Full performance can be found on the company or index summary page on the interactive investor website. Simply click on the company's or index name highlighted in the article.
Disclosure
We use a combination of fundamental and technical analysis in forming our view as to the valuation and prospects of an investment. Where relevant we have set out those particular matters we think are important in the above article, but further detail can be found here.
Please note that our article on this investment should not be considered to be a regular publication.
Details of all recommendations issued by ii during the previous 12-month period can be found here.
ii adheres to a strict code of conduct. Contributors may hold shares or have other interests in companies included in these portfolios, which could create a conflict of interests. Contributors intending to write about any financial instruments in which they have an interest are required to disclose such interest to ii and in the article itself. ii will at all times consider whether such interest impairs the objectivity of the recommendation.
In addition, individuals involved in the production of investment articles are subject to a personal account dealing restriction, which prevents them from placing a transaction in the specified instrument(s) for a period before and for five working days after such publication. This is to avoid personal interests conflicting with the interests of the recipients of those investment articles.