Chart of the week: Microsoft stock at critical juncture
Technical analyst John Burford has spotted a low-risk entry point to trade this $1 trillion company.
12th August 2019 11:25
by John Burford from interactive investor
Technical analyst John Burford has spotted a low-risk entry point to trade this $1 trillion company.

I last covered Microsoft (NASDAQ:MSFT) on 29 April, just after it had become the world's most valuable tech company again after breaking the milestone $1 trillion mark. That's when I sounded a note of caution and, since then, the shares have become even more valuable. However, immediately after my post there was a sharp fall that justified my comments then.
On that date, the shares were making a new high around $130, and I suggested that a turn appeared likely and that the $125 level would be my 'line in the sand' that could signal further declines.
And, in fact, the market did immediately start to move lower and break below my $125 sand line in early June.
So, was that the start of a major decline? I got my answer pretty quickly when I noted the decline was in the form of a three-wave pattern. Since these patterns are always counter-trend, I realised that the uptrend very likely remained in force, and any substantial decline would be delayed.
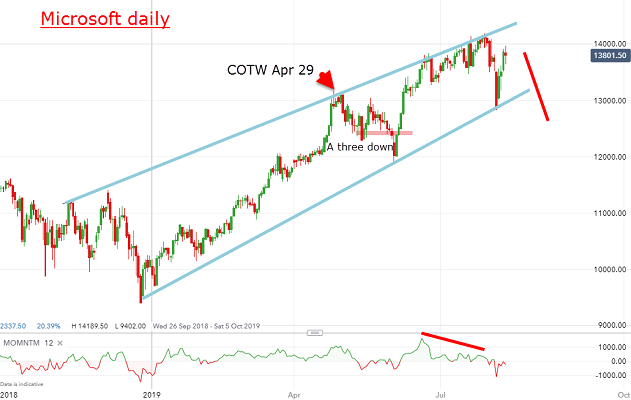
Source: interactive investor Past performance is not a guide to future performance
The pink bar is my 'line in the sand', but note the swift recovery back above it that cancelled out my 'sell' signal. And since early June, the shares have been in a solid uptrend. But now I am able to draw two blue trendlines on the minor highs and lows of the wave off the December low.
The high so far is $142 reached on 29 July and, in the general tech rout of two weeks ago, the shares fell back to bounce off a very accurate hit on my lower trendline. Note that this trendline was drawn off the two previous lows and I simply extended it. So how did the market know that was the proper place to turn several weeks later?
When I draw a trendline between two points and extend it, it is not me who decides where the future support lies - it is the market. The line is always there - all I have to do is 'pencil' it in.
And last week, the shares moved up, but note the very strong momentum divergence as shares made the $142 high, indicating a general weakening of buying pressure. Here is a close-up of recent action:
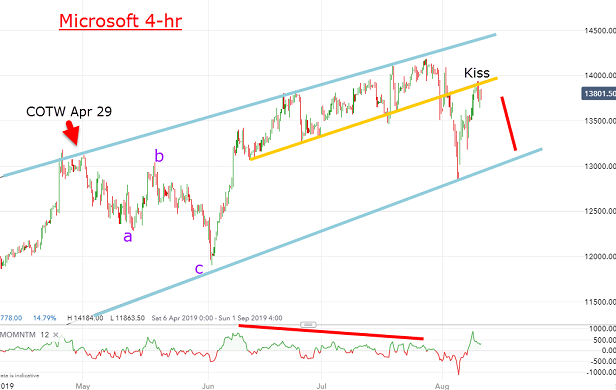
Source: interactive investor Past performance is not a guide to future performance
On this scale, the final push up has a yellow tramline connecting the minor lows which was broken earlier this month, followed by the plunge to the lower blue trendline, and is currently in a push back up. And that push has hit the yellow tramline resistance in what should be a 'kiss'.
And if that is a genuine kiss, it should be followed by a Scalded Cat Bounce down to the lower blue trendline in short order with a likely break.
That places the current position of $138 at an interesting juncture. A short trade here could be protected by a close stop-loss 'buy' order placed above the yellow tramline for a low-risk entry.
In that event, my first target is the $130 area with potential for $120 and then lower.
Only a strong push above $142 would cause me to amend this stance.
For more information about Tramline Traders, or to take a three-week free trial, go to www.tramlinetraders.com.
John Burford is the author of the definitive text on his trading method, Tramline Trading. He is also a freelance contributor and not a direct employee of interactive investor.
These articles are provided for information purposes only. Occasionally, an opinion about whether to buy or sell a specific investment may be provided by third parties. The content is not intended to be a personal recommendation to buy or sell any financial instrument or product, or to adopt any investment strategy as it is not provided based on an assessment of your investing knowledge and experience, your financial situation or your investment objectives. The value of your investments, and the income derived from them, may go down as well as up. You may not get back all the money that you invest. The investments referred to in this article may not be suitable for all investors, and if in doubt, an investor should seek advice from a qualified investment adviser.
Full performance can be found on the company or index summary page on the interactive investor website. Simply click on the company's or index name highlighted in the article.
Disclosure
We use a combination of fundamental and technical analysis in forming our view as to the valuation and prospects of an investment. Where relevant we have set out those particular matters we think are important in the above article, but further detail can be found here.
Please note that our article on this investment should not be considered to be a regular publication.
Details of all recommendations issued by ii during the previous 12-month period can be found here.
ii adheres to a strict code of conduct. Contributors may hold shares or have other interests in companies included in these portfolios, which could create a conflict of interests. Contributors intending to write about any financial instruments in which they have an interest are required to disclose such interest to ii and in the article itself. ii will at all times consider whether such interest impairs the objectivity of the recommendation.
In addition, individuals involved in the production of investment articles are subject to a personal account dealing restriction, which prevents them from placing a transaction in the specified instrument(s) for a period before and for five working days after such publication. This is to avoid personal interests conflicting with the interests of the recipients of those investment articles.