Chart of the week: Chance for all of us to trade Microsoft
Microsoft trades at a record high, but there's something for every investor here, argues our chartist.
29th April 2019 10:58
by John Burford from interactive investor
Microsoft stock trades at record highs, but there's something for every investor here, argues our chartist.

This veritable granddaddy of the global tech industry announced its Q1 results last week – and I believe we can all agree they were blockbuster, leaving aside the question of how valid is the concept of a 'beat' on expectations. Analysts have a habit of under-playing next quarter's forecasts for fear of being over-ambitious. Better for the career of a 'beat' than a 'miss'!
And with these results, the share price was boosted to the $130 region where it valued the company at the $1 trillion mark, joining Apple (NASDAQ:AAPL) and Amazon (NASDAQ:AMZN) in this exclusive club (although as a possible warning, Apple and Amazon have since fallen back). Naturally, the MSM headline writers were not shy trumpeting this fact!
So is reaching this milestone now creating a ceiling, not a floor for the shares? In other words, is this as good as it gets? After all, its standout Azure cloud division reported a whopping 70% growth increase over Q4 which will be a very tough bar to jump over for Q2. Also, I see a rash of super-bullish mainstream media comment – always a warning sign.
Source: interactive investor Past performance is not a guide to future performance
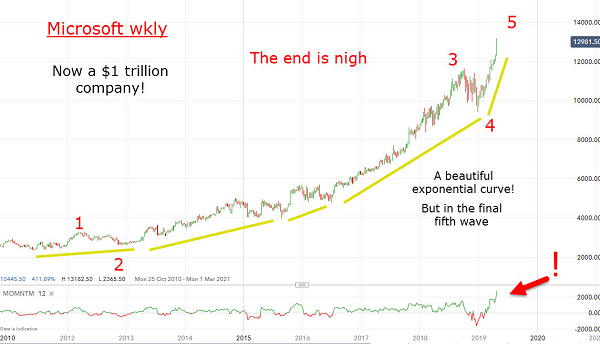
Here is the long-term weekly chart (a place I always like to start when analysing a company's share price history)
From the 2010 lows around the $20 region, the market embarked on a classic exponential path with the advances getting ever steeper. Note the period around 2008, when the general market collapsed in the Credit Crunch wipe-out. The shares dropped from $36 to the $15 low in early 2009 – surely the bargain of the decade. But how many were buying here when fear was sweeping the markets?
And wave 3 topped in October last year along with many others and wave 4 only bottomed at Christmas before staging the near-vertical advance from $95 to the current $132. Note the position of the Momentum Indicator which shows a massively over-bought condition. And no wonder – the post-Christmas advance has been virtually dip-free. The dip buyers have been waiting in vain.
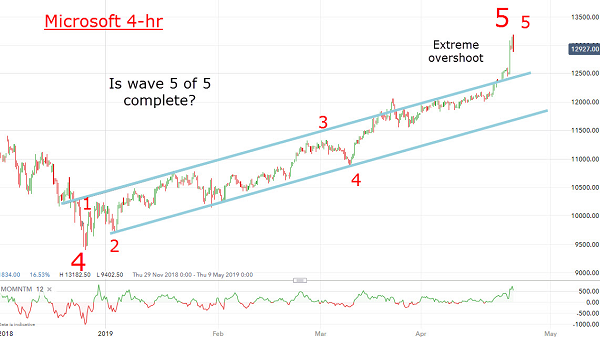
Here is that rally phase on the 4-hr chart
Source: interactive investor Past performance is not a guide to future performance
I have an excellent tramline pair and on Tuesday, the market broke up out of the trading channel in anticipation of 'good' news, which did materialise. Is it possible some had advanced knowledge? Hmm.
In any case, this surge has created a possible 'overshoot' which would be confirmed on a break back into the trading channel around the $125 area. Overshoots, if genuine, indicate a buying climax that kicks off an opposing corrective period.
But so long as the market stays above the upper tramline, the uptrend remains intact.
That makes the $125 level as my line in the sand. If that level breaks, I can see a quick move down to the $112 area with lower potential. I shall be on high alert for a three waves down pattern that always follows a five up.
I believe this is a good case for bulls to take at least some profits here. One caveat: any large correction from here may well be a buying opportunity for long-term investors.
For more information about Tramline Traders, or to take a three-week free trial, go to www.tramlinetraders.com.
John Burford is the author of the definitive text on his trading method, Tramline Trading. He is also a freelance contributor and not a direct employee of interactive investor.
These articles are provided for information purposes only. Occasionally, an opinion about whether to buy or sell a specific investment may be provided by third parties. The content is not intended to be a personal recommendation to buy or sell any financial instrument or product, or to adopt any investment strategy as it is not provided based on an assessment of your investing knowledge and experience, your financial situation or your investment objectives. The value of your investments, and the income derived from them, may go down as well as up. You may not get back all the money that you invest. The investments referred to in this article may not be suitable for all investors, and if in doubt, an investor should seek advice from a qualified investment adviser.
Full performance can be found on the company or index summary page on the interactive investor website. Simply click on the company's or index name highlighted in the article.
Disclosure
We use a combination of fundamental and technical analysis in forming our view as to the valuation and prospects of an investment. Where relevant we have set out those particular matters we think are important in the above article, but further detail can be found here.
Please note that our article on this investment should not be considered to be a regular publication.
Details of all recommendations issued by ii during the previous 12-month period can be found here.
ii adheres to a strict code of conduct. Contributors may hold shares or have other interests in companies included in these portfolios, which could create a conflict of interests. Contributors intending to write about any financial instruments in which they have an interest are required to disclose such interest to ii and in the article itself. ii will at all times consider whether such interest impairs the objectivity of the recommendation.
In addition, individuals involved in the production of investment articles are subject to a personal account dealing restriction, which prevents them from placing a transaction in the specified instrument(s) for a period before and for five working days after such publication. This is to avoid personal interests conflicting with the interests of the recipients of those investment articles.