Chart of the week: A new bear trend for Prudential shares?
After successfully calling both up and downtrends on this blue-chip, here’s this analyst’s next call.
27th January 2020 10:08
by John Burford from interactive investor
After successfully calling both up and downtrends on this blue-chip, here’s this analyst’s next call.

Prudential follows my roadmap
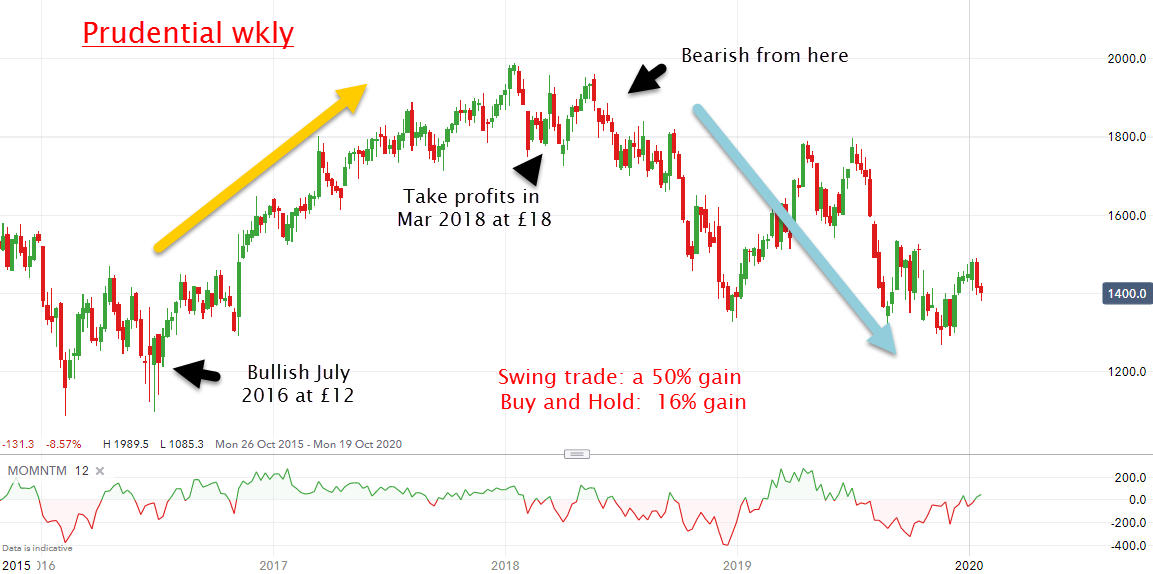
This week, I want to illustrate in my long Prudential (LSE:PRU) campaign how swing trading can often produce far greater returns than the usual Buy-and-Hold strategy. It is a strategy underused by many small traders/investors. Trading both the ups and downs requires some skill, but especially vigilance.
There are many myths floating around the investment world. One of the most glaring is the idea – promoted by most pundits – is that it is impossible to pick tops and bottoms in markets to take advantage of major trend changes. They maintain that the only way for most small investors to invest in shares is to pick great companies and hold the shares for ever.
As any experienced investor has discovered to their cost, some shares do not do the decent thing by advancing for ever into the sunset. They trace out distinct waves up and down – and it is the down waves that can seriously affect your financial health.
I believe I have shown it is possible to pick tops and bottoms with high accuracy, in many cases, from the extensive collection of my COTWs. So how am I doing with my Prudential campaign which I started covering in 2016?
In my COTW of 7 August 2017 I had maintained a bullish stance from 2016 and this is what I wrote then: “Last July, I was bullish when the shares were trading at the £12 level and when I covered it again on 20 March, the market had risen to the £18 level, which was a major target of mine.”
By March 2018 it had hit my major target at £18. This is what I wrote on 7 August 2017: If my labels are correct, we are at or near the end of wave 3 and the next big move will be a decline in wave 4.
So, back in March 2018, I forecast a decline. On that basis, shares would have been sold and short positions could have been taken. Here is the chart updated to today:
Source: interactive investor Past performance is not a guide to future performance
A swing trade from £12 to £18 produced a gain of 50%. Not to mention the gain from any swing short positions taken near the highs to today’s £14 print.
Monday Flash: The FTSE is down hard this morning and Prudential is now trading below £14.
Compare this with the Buy and Hold gain of only 16% to date over 3½ years – a paltry return. Of course, many hold the shares mainly for the dividend yield (currently 3.5%) and are less concerned with the gyrations in the price (assuming the dividend remains safe, of course).
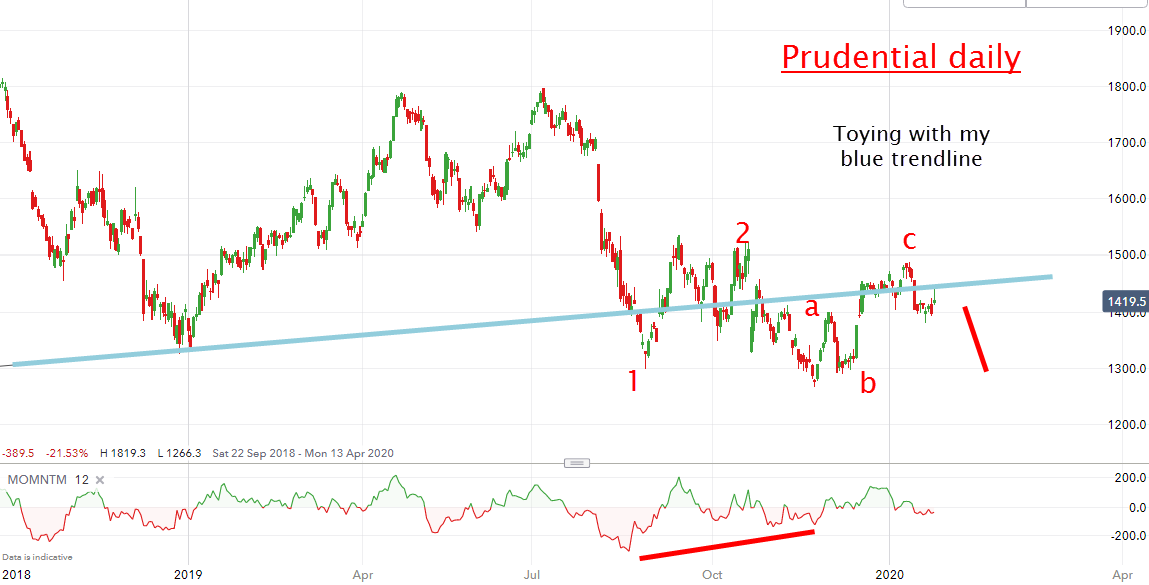
Now the shares have declined to the £14 area, what is my outlook?
Source: interactive investor Past performance is not a guide to future performance
Since last summer, the shares have basically gone nowhere as they hovered around my blue trendline of support/resistance. But with the recent three up (a-b-c) that is typical of corrections, odds swing to a bearish outcome in a third wave down. Only a strong push above £15 would alter this scenario.
Remember, third waves are the longest and strongest in the book, and my first target is the £12.75 area with lower potential to next target at around £11. Recall the 2009 low was £2, and a normal 50% correction from the near-£20 high in January 2018 would set up the same target at £11. That would be a realistic target when the general market enters a severe bear trend.
For more information about Tramline Traders, or to take a three-week free trial, go to www.tramlinetraders.com.
John Burford is the author of the definitive text on his trading method, Tramline Trading. He is also a freelance contributor and not a direct employee of interactive investor.
These articles are provided for information purposes only. Occasionally, an opinion about whether to buy or sell a specific investment may be provided by third parties. The content is not intended to be a personal recommendation to buy or sell any financial instrument or product, or to adopt any investment strategy as it is not provided based on an assessment of your investing knowledge and experience, your financial situation or your investment objectives. The value of your investments, and the income derived from them, may go down as well as up. You may not get back all the money that you invest. The investments referred to in this article may not be suitable for all investors, and if in doubt, an investor should seek advice from a qualified investment adviser.
Full performance can be found on the company or index summary page on the interactive investor website. Simply click on the company's or index name highlighted in the article.
Disclosure
We use a combination of fundamental and technical analysis in forming our view as to the valuation and prospects of an investment. Where relevant we have set out those particular matters we think are important in the above article, but further detail can be found here.
Please note that our article on this investment should not be considered to be a regular publication.
Details of all recommendations issued by ii during the previous 12-month period can be found here.
ii adheres to a strict code of conduct. Contributors may hold shares or have other interests in companies included in these portfolios, which could create a conflict of interests. Contributors intending to write about any financial instruments in which they have an interest are required to disclose such interest to ii and in the article itself. ii will at all times consider whether such interest impairs the objectivity of the recommendation.
In addition, individuals involved in the production of investment articles are subject to a personal account dealing restriction, which prevents them from placing a transaction in the specified instrument(s) for a period before and for five working days after such publication. This is to avoid personal interests conflicting with the interests of the recipients of those investment articles.