Chart of the Week: Persistence pays off for this trade
Persistence pays off for our chartist as a second go at an Amazon short trade proves more successful.
5th August 2019 12:47
by John Burford from interactive investor
Persistence pays off for our chartist as a second go at an Amazon short trade proves more successful.

I last covered this hugely popular share in May, since when it has performed pretty much in line with my expectations – with one small difference that I hope is instructive to those who trade off price charts.
In May, I noted that a very large percentage of US IPOs were launched with negative earnings (otherwise known as losses). To me, that was a clear demonstration that investors’ appetite for anything new and techie was getting carried away in a kind of mania.
And when belief and hope starts to wane, bullish enthusiasm for all things tech quickly dissipates – producing huge losses for many over-hyped issues.
Of course, Amazon (NASDAQ:AMZN) is not in that league, but it is subject to changes in sentiment. Recently, it had been riding high as it is generally seen as the 'category killer' that gobbles up all in its path. But with growing resentment of its power – and threats of fines and taxes on the US tech giants looming in the US and EU, there is a change of sentiment in the air.
Back in May, I was looking for a major top in the shares and this was the daily chart I showed:
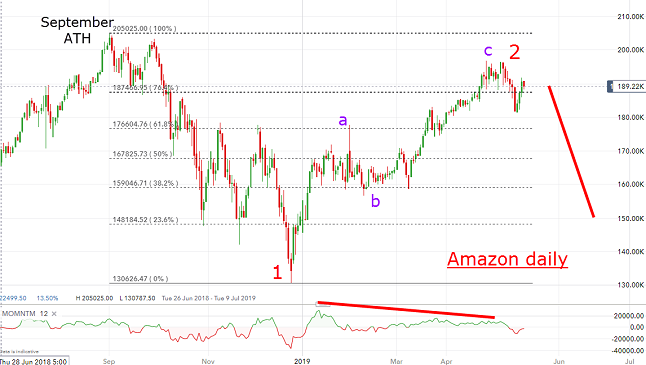
Source: interactive investor Past performance is not a guide to future performance
Odds were good that the all-time high (ATH) of $2,050 of last September would hold and the move down off it showed a clear five waves that implied the trend had changed to down.
The wave 2 rally off the December low appeared to be in the required counter-trend three and I was looking for a move lower from that region. I expected the decline to be swift as signalled by the large momentum divergence.
This is what I wrote in May:
"The bottom line is that I expect the shares to decline (currently $1,870) but a move above the $1,950 level would temporarily suspend this outlook".
So did the shares decline immediately? Certainly! In fact, the decline was quite swift, as I suspected, to a low at $1,670 on 3 June.
But it then just as swiftly reversed back up and later went on to a new high at $2,050 – just to prove that swing traders need to keep watching their backs, especially when the decline was only in a three.
So with the three down indicating more upside, there was one more push above the $2,000 mark but not into a new all-time high – and that was a crucial point. I kept tracking the short term moves and I found a very lovely pink tramline pair working. This is the 4-hr chart:
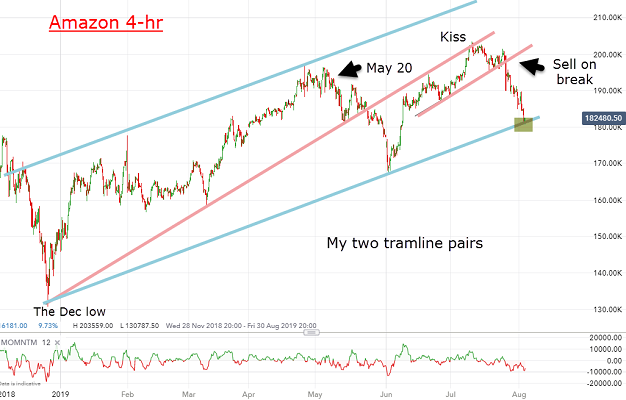
Source: interactive investor Past performance is not a guide to future performance
Note the new $2,034 high placed a 'kiss' goodbye accurately on the upper pink tramline which set up a likely Scalded Cat Bounce down. So the most secure place to enter new short sales was on the break of the lower pink tramline on 25 July at around $1,970 against the $2,034 high.
Lo and behold, the market provided us with a terrific Scalded Cat Bounce and is now testing the lower blue tramline at $1,815. A hard break of this tramline would set up my main first target at the $1,700 region with much lower potential.
But the main takeaway from this campaign using my Tramline method is that my first effort at a short trade did not go to plan exactly, but with persistence my second try is looking good (so far).
For more information about Tramline Traders, or to take a three-week free trial, go to www.tramlinetraders.com.
John Burford is the author of the definitive text on his trading method, Tramline Trading. He is also a freelance contributor and not a direct employee of interactive investor.
These articles are provided for information purposes only. Occasionally, an opinion about whether to buy or sell a specific investment may be provided by third parties. The content is not intended to be a personal recommendation to buy or sell any financial instrument or product, or to adopt any investment strategy as it is not provided based on an assessment of your investing knowledge and experience, your financial situation or your investment objectives. The value of your investments, and the income derived from them, may go down as well as up. You may not get back all the money that you invest. The investments referred to in this article may not be suitable for all investors, and if in doubt, an investor should seek advice from a qualified investment adviser.
Full performance can be found on the company or index summary page on the interactive investor website. Simply click on the company's or index name highlighted in the article.
Disclosure
We use a combination of fundamental and technical analysis in forming our view as to the valuation and prospects of an investment. Where relevant we have set out those particular matters we think are important in the above article, but further detail can be found here.
Please note that our article on this investment should not be considered to be a regular publication.
Details of all recommendations issued by ii during the previous 12-month period can be found here.
ii adheres to a strict code of conduct. Contributors may hold shares or have other interests in companies included in these portfolios, which could create a conflict of interests. Contributors intending to write about any financial instruments in which they have an interest are required to disclose such interest to ii and in the article itself. ii will at all times consider whether such interest impairs the objectivity of the recommendation.
In addition, individuals involved in the production of investment articles are subject to a personal account dealing restriction, which prevents them from placing a transaction in the specified instrument(s) for a period before and for five working days after such publication. This is to avoid personal interests conflicting with the interests of the recipients of those investment articles.