Chart of the week: Rolls-Royce ripe to ‘buy low, sell high’
The aerospace company is set to enter a sharp rally phase, our columnist believes.
15th February 2021 11:39
by John Burford from interactive investor
The aerospace company is set to enter a sharp rally phase, our columnist believes.

Rolls-Royce (LSE:RR.), the icon of the British aerospace industry, has certainly been through some rough times.
Its engine division has been clobbered by the global pandemic lockdowns curtailing air travel. Some say it will not return to its former glory days for years, if at all. Not only that, but jet-fuelled engines that the company produces now carry a certain stigma. But the company is not cowering in the corner waiting for the hangman to arrive. It is moving into other areas, but this will likely take years for any major payoff.
With bullish sentiment on the floor, can there be any hope for the shares as they plumb new depths? I believe that most of the bad news is out of the way and the shares trading under £1 offer an investment with excellent upside potential and low downside risk.
Here is the very long-term chart:
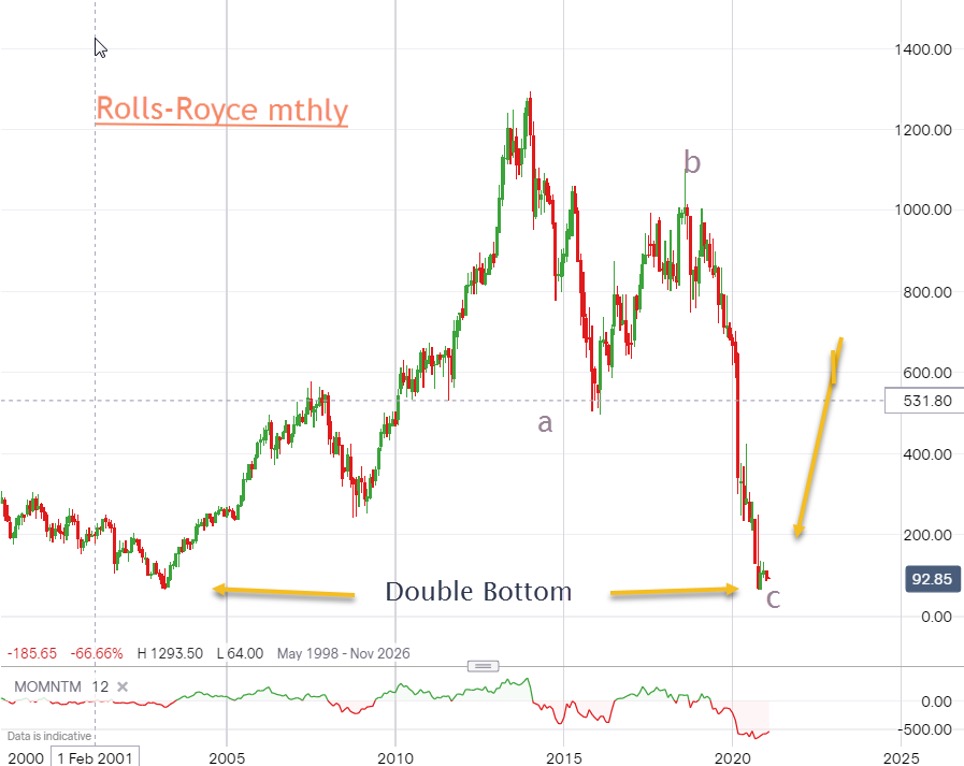
Source: interactive investor. Past performance is not a guide to future performance.
The all-time high of £13 made in January 2014 started a slide down to the current sub-£1 area in three clear waves – and to match the low levels last seen in 2003. This has created a probable double bottom.
To gather clues for a likely upside reversal, here is the weekly chart:
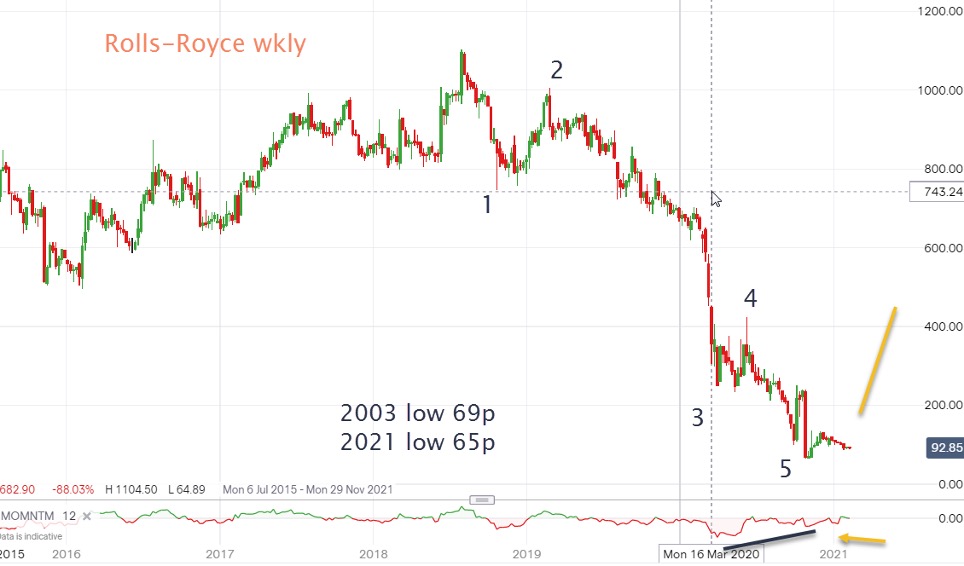
Source: interactive investor. Past performance is not a guide to future performance.
The latest wave down has a potentially complete five waves, but the stand-out feature is the huge momentum divergence at the low that also appears on the monthly chart.
That usually signifies the selling pressure is rapidly drying up and the buying forces are taking over. It is only a matter of time before they dominate and push the shares higher.
- ii view: Rolls-Royce burning through cash fast
- Market snapshot: reasons to be cheerful, Rolls-Royce latest
- Are you saving enough for retirement? Our calculator can help you find out
Remember, my rule that states that in such circumstances with a huge momentum divergence, the snap-back rally is usually very sharp. Investors please note.
Based on my analysis, I expect a sharp rally phase starting now.
Also note that the recent low at 65p came within a whisker of exactly matching the 2003 low! Imagine – after a huge span of 18 years, the market has decided to revert to the same price (within 0.3% of the all-time high). How's that for accuracy?
I am placing this share solidly on my buy low/sell high list at the current 92p. Only an unexpected dip back to the 65p area would send me back to the drawing board.
John Burford is the author of the definitive text on his trading method, Tramline Trading. He is also a freelance contributor and not a direct employee of interactive investor.
These articles are provided for information purposes only. Occasionally, an opinion about whether to buy or sell a specific investment may be provided by third parties. The content is not intended to be a personal recommendation to buy or sell any financial instrument or product, or to adopt any investment strategy as it is not provided based on an assessment of your investing knowledge and experience, your financial situation or your investment objectives. The value of your investments, and the income derived from them, may go down as well as up. You may not get back all the money that you invest. The investments referred to in this article may not be suitable for all investors, and if in doubt, an investor should seek advice from a qualified investment adviser.
Full performance can be found on the company or index summary page on the interactive investor website. Simply click on the company's or index name highlighted in the article.
Disclosure
We use a combination of fundamental and technical analysis in forming our view as to the valuation and prospects of an investment. Where relevant we have set out those particular matters we think are important in the above article, but further detail can be found here.
Please note that our article on this investment should not be considered to be a regular publication.
Details of all recommendations issued by ii during the previous 12-month period can be found here.
ii adheres to a strict code of conduct. Contributors may hold shares or have other interests in companies included in these portfolios, which could create a conflict of interests. Contributors intending to write about any financial instruments in which they have an interest are required to disclose such interest to ii and in the article itself. ii will at all times consider whether such interest impairs the objectivity of the recommendation.
In addition, individuals involved in the production of investment articles are subject to a personal account dealing restriction, which prevents them from placing a transaction in the specified instrument(s) for a period before and for five working days after such publication. This is to avoid personal interests conflicting with the interests of the recipients of those investment articles.