Chart of the week: a second chance to sell Apple
After his perfect call to sell Apple shares at the top, our analyst reveals what could happen next.
4th May 2020 12:14
by John Burford from interactive investor
After his perfect call to sell Apple shares at the top, our technical analyst reveals what he thinks is about to happen next.

Is Apple ripe for picking - again?
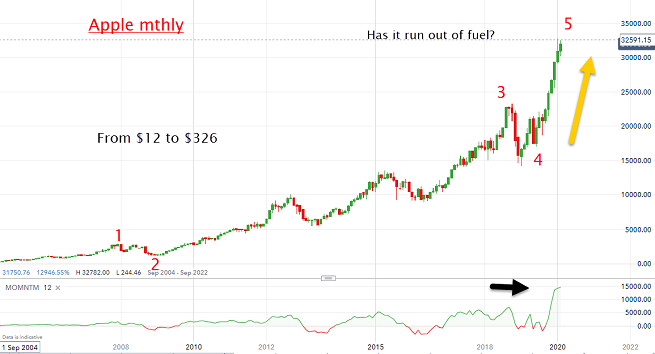
It is well said in the context of the financial markets that no tree grows to the sky – even Apple trees. In my Chart of the Week (COTW) of 10 February, I made the case that Apple (NASDAQ:AAPL) shares were at, or very near, the top of their incredible multi-year ascent and were about to start a major correction lower. They were making a significant top, in my opinion.
I based my case partly on the wave patterns clearly visible on the charts.
From humble beginnings in the early 2000s, the shares rose steadily to waves 1 and 2 and then in the 2010s, they accelerated under the legendary – and much idolised by Apple fans – Steve Jobs, to reach the wave 3 high at $230 in October 2018.
From there, they corrected into the wave 4 low of $142 at Christmas 2018 and from there, the shares simply rocketed, almost vertically last year, to reach the $325 level when I issued my February COTW.

Source: interactive investor. Past performance is not a guide to future performance.
So, was that anywhere near the top of the rally, as I forecast at the time?
This is what I wrote on 10 February:
“The Elliott wave labels on the chart is just one possible interpretation, but either way, a significant decline ahead appears highly likely. With the share price supported by massive stock buy-backs (that can be cut at any time), and the effect of the spreading coronavirus, the way is clear for a possible correction to the $235 area in due course. Investors may wish to take evasive action.”
As it happened, the timing was perfection.
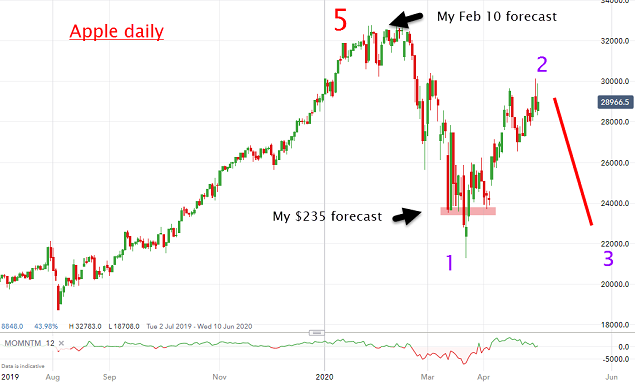
Just a few days afterwards, the shares plunged in the Corona Crash to the March lows. This is the updated chart:

Source: interactive investor. Past performance is not a guide to future performance.
And my important and specific forecast for a decline to the $235 area was also fulfilled – albeit a lot faster than I had expected back in February. That was a loss of over $90 a share (in just six weeks), or 28%.
Investors heeding my advice in February have the satisfaction of exiting at the top. That is something conventional analysts maintain is impossible. “Nobody can time the market” is their plaintive and helpless cry.
Of course, very few analysts who hold to this negative view would ever dream of investigating methods that could possibly aid in the better timing of market entries and exits to maximise performance. I have always been curious why this is so – until I realised that a black sheep (such as yours truly) would never survive inside the herd of conventional pundits. When your lifestyle depends on uttering a lie, truth is far from your lips (for most).
- ii view: Apple sales flat but shares still in demand
- The Ian Cowie portfolio: how I would access this technology boom
- Want to buy and sell international shares? It’s easy to do. Here’s how
So, what is my outlook now that I correctly called the Apple top? The rally off the March lows has been propelled mainly by the public – not the funds – who have been well brainwashed into Buying All Dips. And with Apple trading at a 30% discount, who could possibly resist? It is still a must-have investment, surely?
But the public has a short memory – they forget the disaster in 2018 when the shares fell from $232 to $142 (40%) in three months.
Investor Alert: Apple shares can go down as well as up.
The April rebound has taken the shares to the Fibonacci 76% retrace of the Corona Crash to the $300 area. Now that the army of new buyers have been trapped, unless the shares can push above the old high at $325, the way is clear for another sharp decline in a large third wave that will take the shares below the March lows of $220 – and beyond.
For more information about Tramline Traders, or to take a three-week free trial, go to www.tramlinetraders.com.
John Burford is the author of the definitive text on his trading method, Tramline Trading. He is also a freelance contributor and not a direct employee of interactive investor.
These articles are provided for information purposes only. Occasionally, an opinion about whether to buy or sell a specific investment may be provided by third parties. The content is not intended to be a personal recommendation to buy or sell any financial instrument or product, or to adopt any investment strategy as it is not provided based on an assessment of your investing knowledge and experience, your financial situation or your investment objectives. The value of your investments, and the income derived from them, may go down as well as up. You may not get back all the money that you invest. The investments referred to in this article may not be suitable for all investors, and if in doubt, an investor should seek advice from a qualified investment adviser.
Full performance can be found on the company or index summary page on the interactive investor website. Simply click on the company's or index name highlighted in the article.
Disclosure
We use a combination of fundamental and technical analysis in forming our view as to the valuation and prospects of an investment. Where relevant we have set out those particular matters we think are important in the above article, but further detail can be found here.
Please note that our article on this investment should not be considered to be a regular publication.
Details of all recommendations issued by ii during the previous 12-month period can be found here.
ii adheres to a strict code of conduct. Contributors may hold shares or have other interests in companies included in these portfolios, which could create a conflict of interests. Contributors intending to write about any financial instruments in which they have an interest are required to disclose such interest to ii and in the article itself. ii will at all times consider whether such interest impairs the objectivity of the recommendation.
In addition, individuals involved in the production of investment articles are subject to a personal account dealing restriction, which prevents them from placing a transaction in the specified instrument(s) for a period before and for five working days after such publication. This is to avoid personal interests conflicting with the interests of the recipients of those investment articles.