Chart of the week: A short squeeze could trigger rally
This eyebrow-raising incident only happens when our chartist spots an instant trading opportunity.
17th June 2019 12:03
by John Burford from interactive investor
This data caused an eyebrow-raising incident for our technical analyst that only appears when he spots an instant trading opportunity.

Uber is in the slow lane – can it get on track?
I believe most agree that Uber Technologies' (NYSE:UBER) IPO was an unmitigated flop last month. Last year, many merchant banks gave it a valuation of $120 billion but, at launch, the shares opened at the $45 issue price, valuing it at only $69 billion. Ouch!
And from then on it got worse, with wave upon wave of short selling driving it to a low of $36. How do I know it was a bear raid? Simply because the reported short interest as measured by the number of shares out on loan has reached the staggering height of 70% of outstanding shares! How's that for a vote of no confidence in the company (which already loses about £1 billion a year)?
The consensus seems to be that it will never make a profit – and the shares will sink. But will it?
When I read the short interest data, I immediately had an eyebrow-raising incident that only appears when I spot an instant trading opportunity. Sometimes, a trade simply stares out at me instantly.
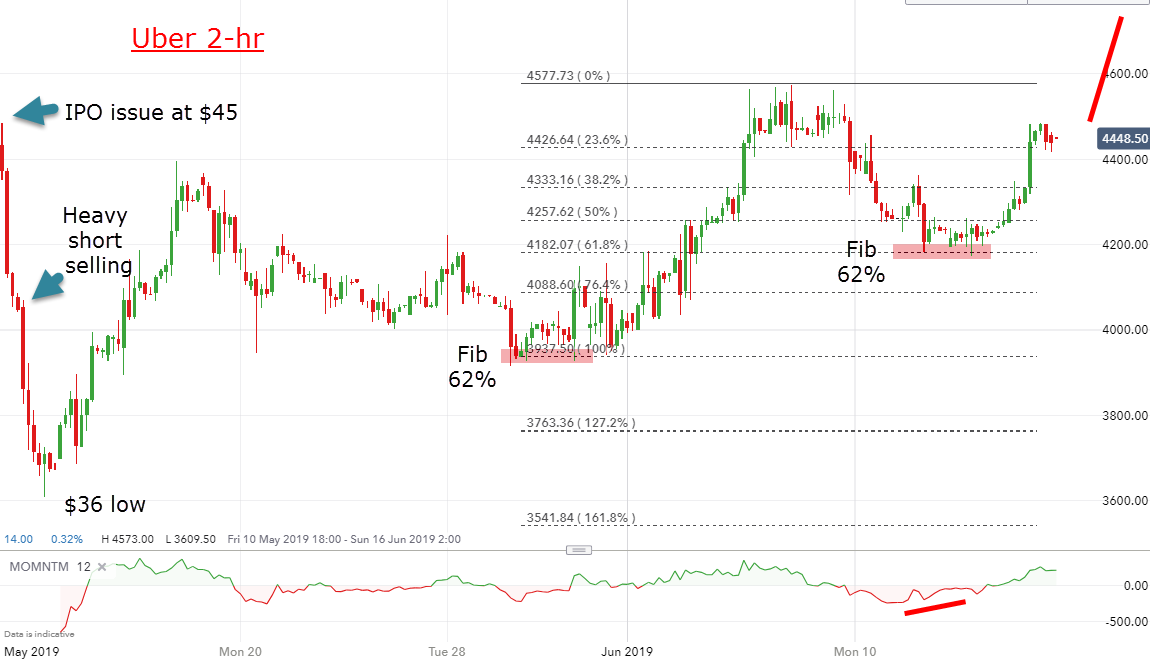
So here is the short chart history on the 2-hour scale:
Source: interactive investor Past performance is not a guide to future performance
From the $36 low, the shares staged a normal rebound (bargain-hunting and short covering?), then fell back in late May, but stopped at the precise Fibonacci 62% retrace of the rebound wave. Remember, I consider the Fibonacci 62% retrace as a ‘normal' correction.
And sure enough, the shares moved higher off there to approach the $45 issue price. And that is where some ‘stale' longs escaped their losses at around break-even – and I am sure breathed a sigh of relief.
Then the dip carried to another Fibonacci 62% retrace of the previous up wave at $41.80 in another superb display of Mr Fibonacci working overtime.
And that is where a low-risk long trade was indicated, with a protective sell stop-loss just below $41.80, just in case the market wanted to dip a little further to perhaps the next Fibonacci level at 76%.
But this is where it starts to get interesting. Recall the huge short interest I mentioned above? Imagine the scene if the shares can push above the $45 issue price. In that case an army of shorts will be nervously eyeing their statements as they observe their losses growing – and wondering if they should cover.
That is how a short squeeze develops that can rocket the market sharply higher from this source alone. It would take perhaps a favourable statement from the company such as growing revenue, or lower costs, or involvement with another sector. Or it may start with no obvious catalyst at all.
Of course, that may not happen at all, but I have a roadmap for the shares if it did – and a close stop in case the bears remain in control. On a potential reward/risk basis, this strikes me as a very good bet.
For more information about Tramline Traders, or to take a three-week free trial, go to www.tramlinetraders.com.
John Burford is the author of the definitive text on his trading method, Tramline Trading. He is also a freelance contributor and not a direct employee of interactive investor.
These articles are provided for information purposes only. Occasionally, an opinion about whether to buy or sell a specific investment may be provided by third parties. The content is not intended to be a personal recommendation to buy or sell any financial instrument or product, or to adopt any investment strategy as it is not provided based on an assessment of your investing knowledge and experience, your financial situation or your investment objectives. The value of your investments, and the income derived from them, may go down as well as up. You may not get back all the money that you invest. The investments referred to in this article may not be suitable for all investors, and if in doubt, an investor should seek advice from a qualified investment adviser.
Full performance can be found on the company or index summary page on the interactive investor website. Simply click on the company's or index name highlighted in the article.
Disclosure
We use a combination of fundamental and technical analysis in forming our view as to the valuation and prospects of an investment. Where relevant we have set out those particular matters we think are important in the above article, but further detail can be found here.
Please note that our article on this investment should not be considered to be a regular publication.
Details of all recommendations issued by ii during the previous 12-month period can be found here.
ii adheres to a strict code of conduct. Contributors may hold shares or have other interests in companies included in these portfolios, which could create a conflict of interests. Contributors intending to write about any financial instruments in which they have an interest are required to disclose such interest to ii and in the article itself. ii will at all times consider whether such interest impairs the objectivity of the recommendation.
In addition, individuals involved in the production of investment articles are subject to a personal account dealing restriction, which prevents them from placing a transaction in the specified instrument(s) for a period before and for five working days after such publication. This is to avoid personal interests conflicting with the interests of the recipients of those investment articles.