Chart of the week: start of a strong rally phase for this stock?
Our technical analyst believes this is a low risk trade that could return 25% or more in time.
6th April 2020 10:11
by John Burford from interactive investor
Our technical analyst believes this is a low risk trade that could return 25% or more in time.

Is Fresnillo a Buy here?
Is the enforced isolation due to the plague getting you down? While most are going quietly along with the government’s ‘advice’ (aka orders) to stay indoors, anger is mounting over its failure to prepare for the current pandemic, as other countries (notably Germany and some Asian nations) have.
But as a trader who tries to understand – and anticipate -the markets’ moves ahead of time, following the virus news is a dead end to profit-making.
In fact, the appearance of the coronavirus was the perfect final insurmountable Wall of Worry that the debt-fuelled markets and economies ran slap bang into.
Last year, all Walls of Worry were never too high for the exponentially advancing markets to steamroller over. But now, markets are declining hard in a Slope of Hope.
It’s a totally different environment.
But do I have a light at tunnel-end that is not an approaching express train? I may have one in Fresnillo (LSE:FRES).
This silver-mining stalwart of the FTSE 100 is an old friend of COTW. I last covered it on 13 January where I took a bearish stance.
This was the chart I showed then:
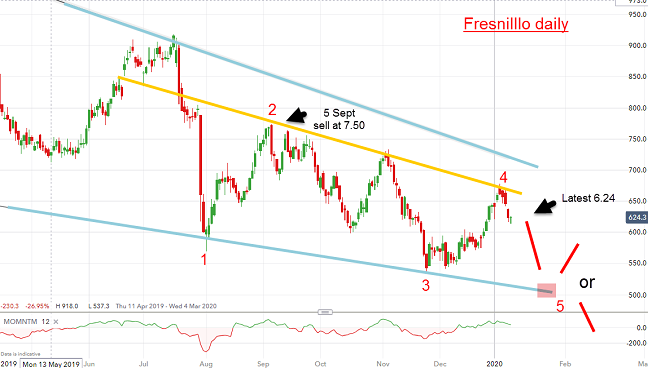
Source: interactive investor Past performance is not a guide to future performance
The blue trendlines are the edges of my Fresnillo Wedge that dates back to 2016. The shares were already in a downtrend within this wedge and, in January, I projected a decline to at least the lower line as clearly shown in the chart.
This is what I wrote in January as the shares traded at the £6.24 level:
“So unless they can push up above the £17.50 level, which I consider unlikely, I maintain my bearish outlook. In fact, I expect silver prices to trend lower this year”
In fact, they have trended lower, but in an erratic fashion. Note that this was contrary to majority opinion that held that gold and silver would be havens of safety in the new world of falling share prices.
Surely, Fresnillo could not decline in value?
But it did – here is the updated weekly chart showing the extent and beauty of the Wedge:
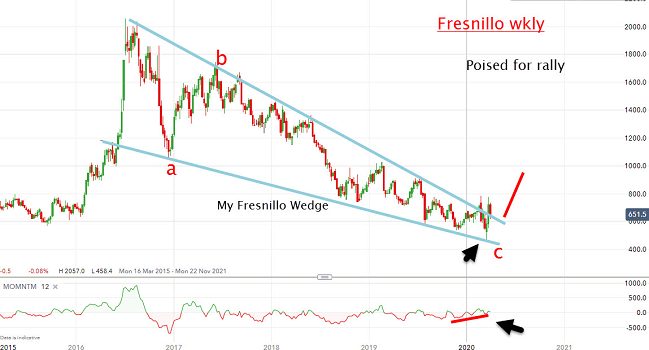
Source: interactive investor Past performance is not a guide to future performance
And the decline continued into mid-March when they tested the lower wedge line at £4.60 but on a strong momentum divergence (lower arrow). That gave a clue that the wedge support would likely hold.
And so it did, with the shares pushing strongly above the wedge line on 24 March. So, is this the start of a strong rally phase?
With the shares now back testing the upper wedge support line around the £6.50 area, I believe there is a low risk trade waiting with the shares poised to advance to at least the £8 area with the £9 region as a distinct possibility, while £11 is not out of the question in due course. Only a move below the £5 level would send me back to the drawing board.
For more information about Tramline Traders, or to take a three-week free trial, go to www.tramlinetraders.com.
John Burford is the author of the definitive text on his trading method, Tramline Trading. He is also a freelance contributor and not a direct employee of interactive investor.
These articles are provided for information purposes only. Occasionally, an opinion about whether to buy or sell a specific investment may be provided by third parties. The content is not intended to be a personal recommendation to buy or sell any financial instrument or product, or to adopt any investment strategy as it is not provided based on an assessment of your investing knowledge and experience, your financial situation or your investment objectives. The value of your investments, and the income derived from them, may go down as well as up. You may not get back all the money that you invest. The investments referred to in this article may not be suitable for all investors, and if in doubt, an investor should seek advice from a qualified investment adviser.
Full performance can be found on the company or index summary page on the interactive investor website. Simply click on the company's or index name highlighted in the article.
Disclosure
We use a combination of fundamental and technical analysis in forming our view as to the valuation and prospects of an investment. Where relevant we have set out those particular matters we think are important in the above article, but further detail can be found here.
Please note that our article on this investment should not be considered to be a regular publication.
Details of all recommendations issued by ii during the previous 12-month period can be found here.
ii adheres to a strict code of conduct. Contributors may hold shares or have other interests in companies included in these portfolios, which could create a conflict of interests. Contributors intending to write about any financial instruments in which they have an interest are required to disclose such interest to ii and in the article itself. ii will at all times consider whether such interest impairs the objectivity of the recommendation.
In addition, individuals involved in the production of investment articles are subject to a personal account dealing restriction, which prevents them from placing a transaction in the specified instrument(s) for a period before and for five working days after such publication. This is to avoid personal interests conflicting with the interests of the recipients of those investment articles.