Chart of the week: is Tesla losing its lustre?
Sentiment has changed on the electric carmaker, but things could shift fast.
24th May 2021 12:52
by John Burford from interactive investor
Sentiment has changed on the electric carmaker, but things could shift fast.

Where next for electric vehicle maker Tesla (NASDAQ:TSLA)?
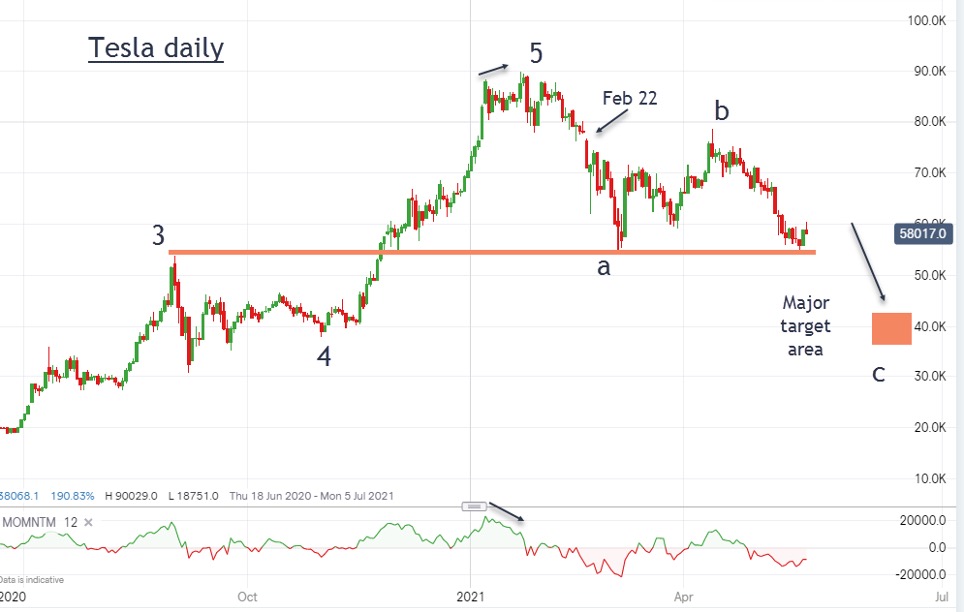
I last covered Tesla in my column of 22 February, which maintained my bearish stance when the shares were standing at the $720 (£509.51) mark. They had made an all-time high at $900 on 26 January, which I believed would hold for a very long time.
The shares are currently trading at the $580 region for a loss of 35% off the all-time high. I have been suggesting taking profits since January.
Interestingly, since February more adverse news about the cars has emerged, including collision fatalities when in auto-pilot mode. This follows the age-old principle of markets that when in a strong trend, the news – 'good' or 'bad' - becomes favourable to that trend – or at least the common interpretation of the news.
In a bear trend, 'bad' news augments that trend. But when in a bull market, 'bad' news puts hardly a dent in that trend. This explains why we often see perverse reactions to certain news events that 'should' have sent markets the other way.
- Why Tesla shares fell after its Q1 results
- 20 most-popular international shares in April 2021
- Are you saving enough for retirement? Our calculator can help you find out
It is not the news that drives markets, but the prevailing sentiment/mood. If only we had a mood-ometer to accurately measure it! Alas, we must infer it from other observations and it is a somewhat hit-and-miss affair.
But sometimes, sentiment extremes really do stand out – such as the near-universal positive mood towards Tesla a few months ago.
But now sentiment has taken a darker tone and fewer investors believe it will be the major electric vehicle player in the years ahead.
This is what I wrote in February: “With the legacy manufacturers hot on their heels, how much longer can Tesla maintain its current lead? Prudence suggests taking at least some profits in Tesla, as I suggested in November.”
Here is the updated daily chart:
Past performance is not a guide to future performance.
Immediately following my 22 February post, the shares embarked on a major move lower only to bottom at the chart support at the $580 mark on 5 March.
It then traced out a classic three-wave correction up to $780, but then topped out as bearish news from China emerged. That was wave 'b' of what should be an a-b-c pattern that should end around the $400 region, which is my original target area from January. That would represent a classic Fibonacci 2/3 correction to the entire bull run.
And since February, more competitive electric vehicles are being launched by the legacy manufacturers to take even more shine off Tesla – and a break of my pink chart support zone around $550 appears imminent.
Incidentally, the other leader of the current speculative mania I am using is bitcoin - and that is likewise down by over 50% off its all-time high. Is it a coincidence that both markets are heavily impacted by the tweets of a certain Mr Musk?
He seems able to move markets with a single tweet. If so, can a few well-judged tweets from him get both markets back where they were only weeks ago? Hmm.
John Burford is the author of the definitive text on his trading method, Tramline Trading. He is also a freelance contributor and not a direct employee of interactive investor.
These articles are provided for information purposes only. Occasionally, an opinion about whether to buy or sell a specific investment may be provided by third parties. The content is not intended to be a personal recommendation to buy or sell any financial instrument or product, or to adopt any investment strategy as it is not provided based on an assessment of your investing knowledge and experience, your financial situation or your investment objectives. The value of your investments, and the income derived from them, may go down as well as up. You may not get back all the money that you invest. The investments referred to in this article may not be suitable for all investors, and if in doubt, an investor should seek advice from a qualified investment adviser.
Full performance can be found on the company or index summary page on the interactive investor website. Simply click on the company's or index name highlighted in the article.
Disclosure
We use a combination of fundamental and technical analysis in forming our view as to the valuation and prospects of an investment. Where relevant we have set out those particular matters we think are important in the above article, but further detail can be found here.
Please note that our article on this investment should not be considered to be a regular publication.
Details of all recommendations issued by ii during the previous 12-month period can be found here.
ii adheres to a strict code of conduct. Contributors may hold shares or have other interests in companies included in these portfolios, which could create a conflict of interests. Contributors intending to write about any financial instruments in which they have an interest are required to disclose such interest to ii and in the article itself. ii will at all times consider whether such interest impairs the objectivity of the recommendation.
In addition, individuals involved in the production of investment articles are subject to a personal account dealing restriction, which prevents them from placing a transaction in the specified instrument(s) for a period before and for five working days after such publication. This is to avoid personal interests conflicting with the interests of the recipients of those investment articles.