Chart of the week: The three possible outcomes for FTSE 100
10th December 2018 12:20
by John Burford from interactive investor
Stockmarket volatility has seen many traders 'whipsawed to destruction', but chartist John Burford scored a direct hit with his prediction. This is what he thinks could happen next.

FTSE 100 continues to follow my roadmap down
I have been bearish on the FTSE 100 for some time – actually since the all-time high in August when I recognised the end of a large five-wave pattern (see below).
Since that time, we have witnessed several large swings both up and down in the global indexes, making swing trading perilous as many traders have been whipsawed to destruction, especially in the US indexes.
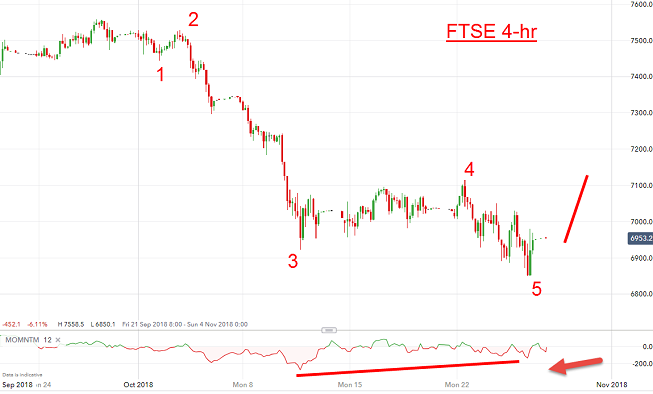
I last covered it in my COTW of 29 October when I spotted a likely near-term bounce from the hard downtrend then in force.
This was the 4-hr chart I showed then:
Source: interactive investor Past performance is not a guide to future performance
…and this is what I wrote:
"The bottom line: This is a great place to take some profits on shorts if trading short term. For traders who are comfortable trading against the major trend (down), going long carries a low risk (to the wave 5 low). Under very favourable conditions (such as the Fed announcing a go-slow on its Quantitative Tightening), a wave 2 rally to the 7,200 area is likely."
Basically, I was looking for an immediate bounce that could reach the 7,200 area. Why was such a forecast useful? Because it allowed shorts to be covered at a huge profit and long positions to be taken before taking those profits at 7,200 (if reached) – and then position short again.
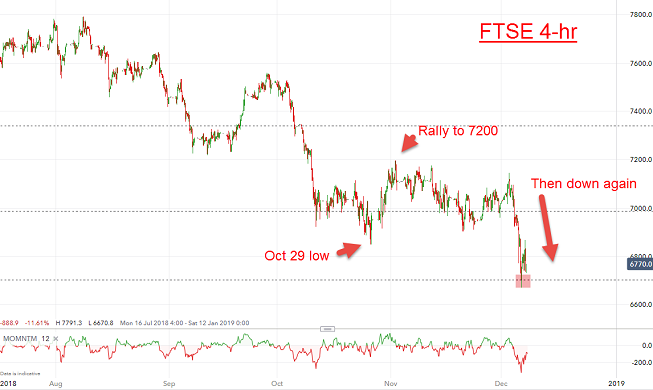
So how did that work out? Here is the chart updated:
Source: interactive investor Past performance is not a guide to future performance
And yes, it rallied to a top tick of 7,196. I call that a direct hit. Nimble traders thus took profits on shorts at the October 29 low, rode the rally to the 7,200 area and took those profits and then re-entered shorts which are still open.
And from the 7,200 area, the market has resumed its downtrend and has met the Fibonacci 50% retrace of the entire rally off the important February 2016 low.
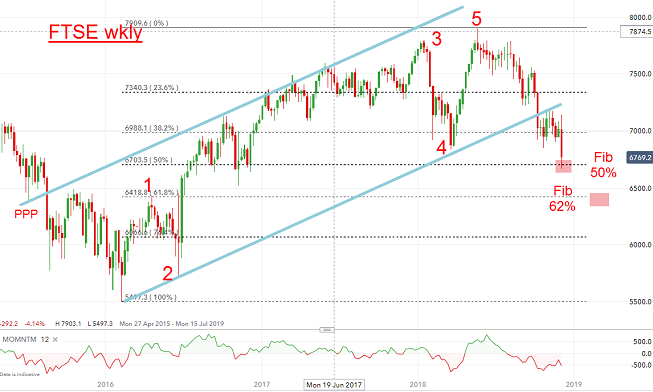
Here is the weekly chart of that rally phase from 2016 for perspective:
Source: interactive investor Past performance is not a guide to future performance
The blue tramlines are practically textbook and they contain the entire five wave action. Note that the rally to 7,200 was a normal pull-back to the lower tramline, kissed it and moved sharply lower in a typical Scalded Cat Bounce down. That was a terrific place to enter short trades at low risk (see above).
With the market now testing the Fibonacci 50% support, we could see another bounce from here, or it could move immediately down to the Fibonacci 62% support at the 6,400 area before a meaningful rally can develop.
On the other hand, the move down off the August all-time high is a series of 1-2 waves as can be seen on the daily:
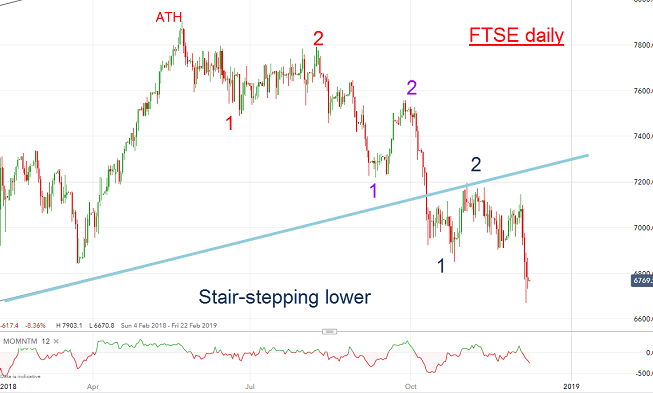
Source: interactive investor Past performance is not a guide to future performance
This stair-stepping pattern usually results in a savage and rapid decline phase that can push aside all 'normal' support areas. Only a near-term rally above the 7,200 area could nix this scenario.
Scanning the mainstream media, I note many commentators are flummoxed by the 'sudden' share wipe-out. That is because they still cling to the incorrect paradigm of 'the news makes the market' - and the broad economic news in the USA (and UK) remains pretty good.
They point out that earnings are still growing, interest rates remain relatively low, and US share valuations are mostly modest. Yes, that may all be true, but markets look forward and not backwards (where all economic data resides) – and they are not liking what they see.
Sentiment has turned on a dime in early October when the Dow/S&P made their all-time highs. They are off by 10% in only two months as the winds of change sweep through Wall Street – and investors are slowly waking up to Goldilocks going missing.
For more information about Tramline Traders, or to take a three-week free trial, go to www.tramlinetraders.com.
*Horizontal lines on charts represent levels of previous technical support and resistance.
John Burford is the author of the definitive text on his trading method, Tramline Trading. He is also a freelance contributor and not a direct employee of interactive investor.
These articles are provided for information purposes only. Occasionally, an opinion about whether to buy or sell a specific investment may be provided by third parties. The content is not intended to be a personal recommendation to buy or sell any financial instrument or product, or to adopt any investment strategy as it is not provided based on an assessment of your investing knowledge and experience, your financial situation or your investment objectives. The value of your investments, and the income derived from them, may go down as well as up. You may not get back all the money that you invest. The investments referred to in this article may not be suitable for all investors, and if in doubt, an investor should seek advice from a qualified investment adviser.
Full performance can be found on the company or index summary page on the interactive investor website. Simply click on the company's or index name highlighted in the article.
Disclosure
We use a combination of fundamental and technical analysis in forming our view as to the valuation and prospects of an investment. Where relevant we have set out those particular matters we think are important in the above article, but further detail can be found here.
Please note that our article on this investment should not be considered to be a regular publication.
Details of all recommendations issued by ii during the previous 12-month period can be found here.
ii adheres to a strict code of conduct. Contributors may hold shares or have other interests in companies included in these portfolios, which could create a conflict of interests. Contributors intending to write about any financial instruments in which they have an interest are required to disclose such interest to ii and in the article itself. ii will at all times consider whether such interest impairs the objectivity of the recommendation.
In addition, individuals involved in the production of investment articles are subject to a personal account dealing restriction, which prevents them from placing a transaction in the specified instrument(s) for a period before and for five working days after such publication. This is to avoid personal interests conflicting with the interests of the recipients of those investment articles.