Chart of the week: a top tip for limiting your trading losses
11th October 2021 10:27
by John Burford from interactive investor
Any time you lose no money on a failed trade feels almost like a success, argues this top technical analyst. Here’s how he does it.

The up/down Japan 225 (Nikkei) move is a lesson in risk control
I believe most traders/investors do not have a 100% success rate in their trades/investments if they have been active for a while. Most would acknowledge that fact. And most would agree that to make a good trade/investment, the timing of the entry (and exit) is absolutely crucial to the success or otherwise of their actions.
And that brings the concept of risk into clear focus.
In an extreme case, say you bought a share at 100, and then watch it slump to 50 in two years, before rising to 120 in three years. Would you call that a successful operation? I would not, simply because the holding of a losing position for two years tied up precious capital that you could have potentially profitably employed elsewhere. Two years is an eternity in some markets!
That is why I spend much time and effort trying to time my entries as close as possible to the start of a major rally phase. In that way, if the market goes according to plan, I start off with a winning position and my initial risk is small. That surely must be a major goal of anyone.
But of course, all budding rallies can be nipped in the bud by subsequent market action – and the Japan 225, the Nikkei, is a current case in point.
I covered this index for my COTW of 6 September, and this was the chart I posted that I used to offer a buy recommendation:
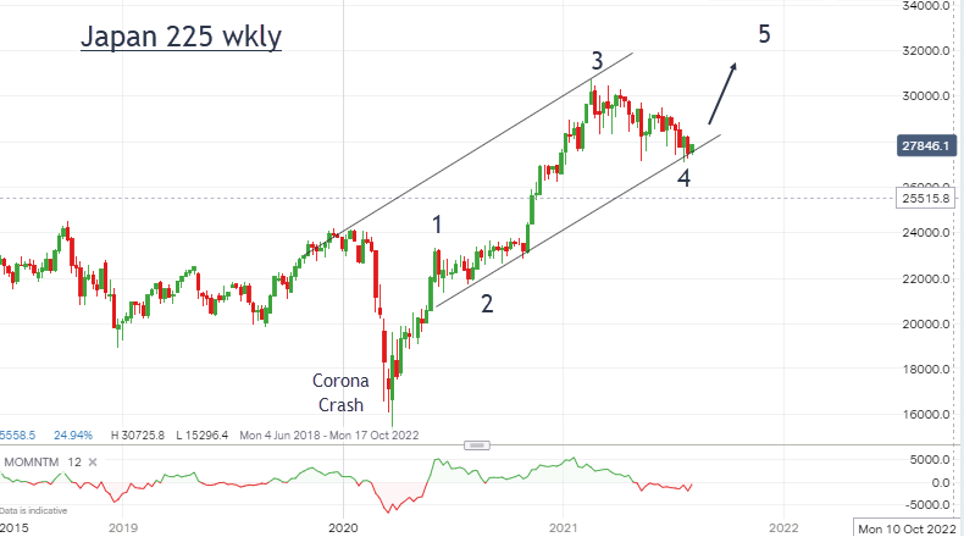
Past performance is no guide to future performance
From the Corona Crash low of March 2020, the index climbed hard in common with the US indexes. I was able to draw a pair of trendlines joining the major highs and lows and suggest there was one more wave in a final fifth wave up from the current wave 4 low.
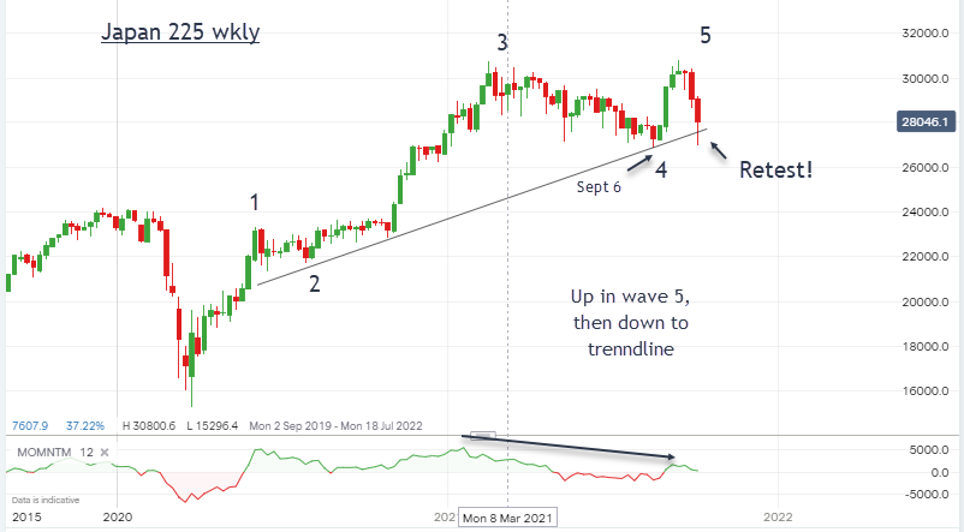
So, did the market follow my roadmap in September? I believe it did, and here is the chart updated:
Past performance is no guide to future performance
As outlined from the smaller scale charts last time, the market surged up and I was looking for a new high in wave 5. In fact, it did manage to exceed the wave 3 high but by less than 200 points before turning. And that was enough to qualify as a genuine wave 5 top. Like many technicians, I was then on the lookout for a reversal lower given the large momentum divergence at the new high.
Right on cue, the market then fell out of bed and came right back to re-test the major trendline last week and move back under our original entry.
That gave us an opportunity to exit the trade at breakeven since a bullish outlook had been fulfilled to the wave 5 high, but has now been likely cancelled by the sharp pullback.
The whole bullish scenario that had lasted since 2009 was hit on the head on 14 September, the date of the wave 5 high. That's how quickly markets can turn.
- Open an ISA with interactive investor. Click here to find out how
- Subscribe to the ii YouTube channel for our latest interviews
That whole exercise resulted in zero loss and tied up capital only for one month. I judge that to be a worthwhile trade. Any time you lose no money on a failed trade feels almost like a success!
Of course, because markets are never 100% predictable, it is possible the index could recover and go on to make new highs. But a hard break of the major trendline would severely lessen these odds.
John Burford is the author of the definitive text on his trading method, Tramline Trading. He is also a freelance contributor and not a direct employee of interactive investor.
These articles are provided for information purposes only. Occasionally, an opinion about whether to buy or sell a specific investment may be provided by third parties. The content is not intended to be a personal recommendation to buy or sell any financial instrument or product, or to adopt any investment strategy as it is not provided based on an assessment of your investing knowledge and experience, your financial situation or your investment objectives. The value of your investments, and the income derived from them, may go down as well as up. You may not get back all the money that you invest. The investments referred to in this article may not be suitable for all investors, and if in doubt, an investor should seek advice from a qualified investment adviser.
Full performance can be found on the company or index summary page on the interactive investor website. Simply click on the company's or index name highlighted in the article.
Disclosure
We use a combination of fundamental and technical analysis in forming our view as to the valuation and prospects of an investment. Where relevant we have set out those particular matters we think are important in the above article, but further detail can be found here.
Please note that our article on this investment should not be considered to be a regular publication.
Details of all recommendations issued by ii during the previous 12-month period can be found here.
ii adheres to a strict code of conduct. Contributors may hold shares or have other interests in companies included in these portfolios, which could create a conflict of interests. Contributors intending to write about any financial instruments in which they have an interest are required to disclose such interest to ii and in the article itself. ii will at all times consider whether such interest impairs the objectivity of the recommendation.
In addition, individuals involved in the production of investment articles are subject to a personal account dealing restriction, which prevents them from placing a transaction in the specified instrument(s) for a period before and for five working days after such publication. This is to avoid personal interests conflicting with the interests of the recipients of those investment articles.