Chart of the week: Trading this FTSE 100 favourite
Showing excellent trading potential, our technical analyst reveals his target for this blue-chip share.
18th February 2019 12:09
by John Burford from interactive investor
Showing excellent trading potential, our technical analyst reveals his target for this blue-chip share.

What comes next for NEXT?
Next (LSE:NXT) used to be one of the darlings of the Stock Exchange with its trendy fashions and big online presence – a factor sadly missing from many of its rivals at the time. But the highly stretched valuation had reached its zenith with the thrust to the November 2015 high at the £82 level.
And, since then, the shares have traced out very large waves both up and down allowing nimble traders plenty of scope for profitable activity. Here is the long range weekly chart showing a clear complete five-up Elliott Wave pattern to the high:
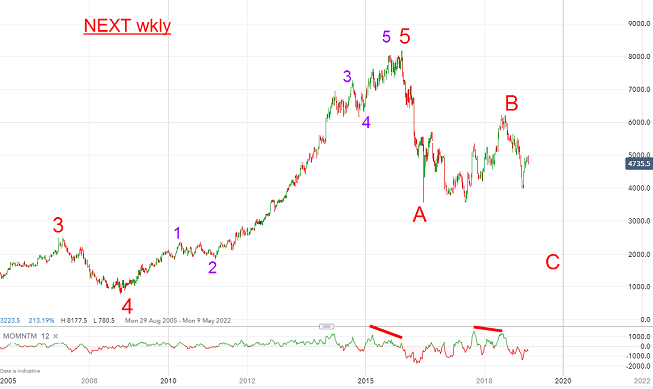
Source: interactive investor Past performance is not a guide to future performance
The red wave 5 also sports a clear five up into the £82 high to a solid momentum divergence which heralded the initial sharp decline to my A wave low at £35 – a loss of £47 (about a Fibonacci 62%). Ouch!
Naturally, an investor who followed the Elliott Wave model would have likely jumped ship well before that time. Sadly, 'Buy and Hold' investors are still under water if they had bought in the last six years.
So where are we now? Does the picture appear bullish, bearish or neutral?
If my wave labels are correct, we are in wave C down off the wave B high at £62.
Here is the close-up of recent action:
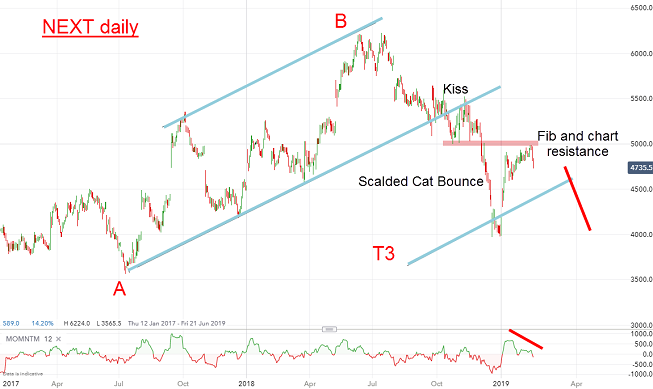
Source: interactive investor Past performance is not a guide to future performance
There are several notable features of this chart. First, I have excellent tramlines including a third equidistant tramline T3. Setting such a tramline below an established tramline pair will usually give you a good target to aim for. And, in fact, it did just that when the shares kissed the underside of the centre tramline and then staged a normal 'scalded cat bounce' down to T3.
I have found that when a market breaks below an up-sloping lower tramline, plants a kiss and starts to back away, it will soon crash in a very rapid manner to the next support area.
This rapid move I call a 'scalded cat bounce' in honour of the more famous 'dead cat bounce'. In this case, the cat is very much nor dead – it merely scampers away from the source of the hot water.
From the T3 support, the shares have rebounded as the general market has recovered this year. Also, the market was expecting dire Christmas trading results which was proved completely wrong (not the first time this has happened!) – and much short covering ensued in January.
But with the shares currently at the £48-£50 area and into major resistance (on a very strong momentum divergence), they are vulnerable to a swift resumption of the decline in wave C which would take them below the T3 low at £40. Breaking below that would set up the next target at the A wave low at £35.
John Burford is the author of the definitive text on his trading method, Tramline Trading. He is also a freelance contributor and not a direct employee of interactive investor.
These articles are provided for information purposes only. Occasionally, an opinion about whether to buy or sell a specific investment may be provided by third parties. The content is not intended to be a personal recommendation to buy or sell any financial instrument or product, or to adopt any investment strategy as it is not provided based on an assessment of your investing knowledge and experience, your financial situation or your investment objectives. The value of your investments, and the income derived from them, may go down as well as up. You may not get back all the money that you invest. The investments referred to in this article may not be suitable for all investors, and if in doubt, an investor should seek advice from a qualified investment adviser.
Full performance can be found on the company or index summary page on the interactive investor website. Simply click on the company's or index name highlighted in the article.
Disclosure
We use a combination of fundamental and technical analysis in forming our view as to the valuation and prospects of an investment. Where relevant we have set out those particular matters we think are important in the above article, but further detail can be found here.
Please note that our article on this investment should not be considered to be a regular publication.
Details of all recommendations issued by ii during the previous 12-month period can be found here.
ii adheres to a strict code of conduct. Contributors may hold shares or have other interests in companies included in these portfolios, which could create a conflict of interests. Contributors intending to write about any financial instruments in which they have an interest are required to disclose such interest to ii and in the article itself. ii will at all times consider whether such interest impairs the objectivity of the recommendation.
In addition, individuals involved in the production of investment articles are subject to a personal account dealing restriction, which prevents them from placing a transaction in the specified instrument(s) for a period before and for five working days after such publication. This is to avoid personal interests conflicting with the interests of the recipients of those investment articles.