Chart of the Week: The verdict on Lloyds Banking shares
3rd December 2018 10:35
by John Burford from interactive investor
Having taken another look at Lloyds Banking Group, our technical analyst John Burford continues to see the shares in a downtrend.

I make no apologies for my extensive coverage of Lloyds. The aim is to demonstrate my alternative route to assess good trades other than the conventional one of data analysis.
The bank has long been considered a bellwether for the UK economy (as is Barclays, another share in a strong bear trend). In more unforgiving times, such as we are now in, data analysis of 'value', dividend history, Return on Equity and so on can become irrelevant in the face of a tsunami of selling induced by fear of the future when debt levels are monumental - and universal.
One of the features of my Tramline Trading method is that I can often construct an accurate roadmap for future price action on many time scales, including the short term. When tuned into the market in this way, it is as if the market participants are all singing from my hymn sheet!
Of course, my forecasts are all probabilistic and not all pan out — and I am the first to admit it. But I know very quickly when that is the case - and can take avoiding action to limit losses.
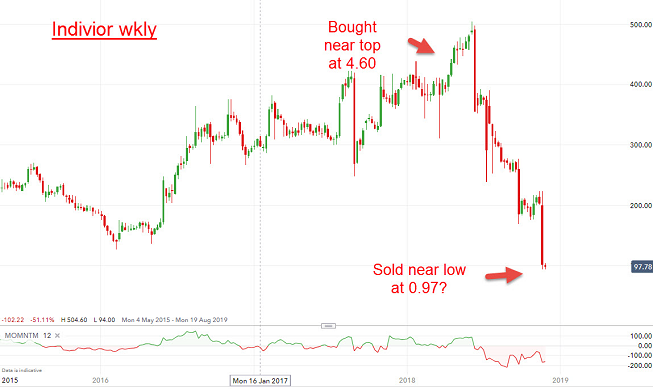
This approach is very different from that of most investors, which is Buy-and-Hold. Here is a well-known tipster from a national newspaper who tipped Indivior in March at 460p and saw it fall all the way down to the recent 97p - a horrendous decline of 75%.
Last week the author offered his readers two options: "Expect further losses" or "Dump 'em", which is obviously the most bearish advice you can express.
My conclusion? With that extreme bearish sentiment probably widespread among Indivior investors who bought at 460p, they must be a screaming buy now for a patient investor! I see they have crept up to 105p as I write.
Source: interactive investor Past performances is not a guide to future performance
But what a vivid example how most investors act - they buy high and sell low. If there is one thing I want to impress on my readers it is this: Do the opposite and buy low and sell high (in either order!).
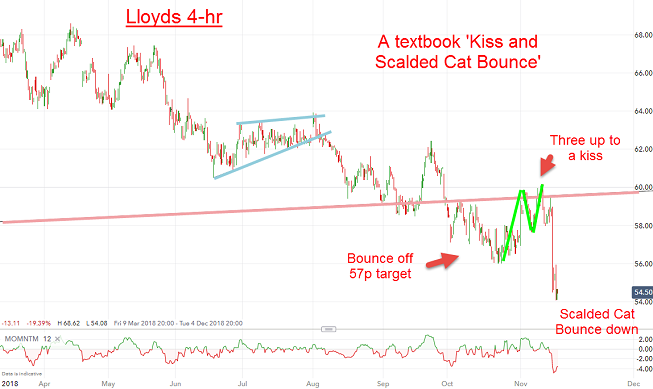
Back to Lloyds (where we sold high) - and true to form, the shares are performing as I forecast. This was the short term 4-hr chart I showed on 19 November:
Source: interactive investor Past performances is not a guide to future performance
There was a break of the major pink trendline (support), a bounce off my 57p target and a pull-back to kiss the support line (now resistance), where short trades at low risk were offered, and then a Scalded Cat Bounce down.
Why do I say low risk? Simply because a protective stop can be placed just above the pink resistance in case my analysis is wrong. If this occurred, we take a small loss and move on.
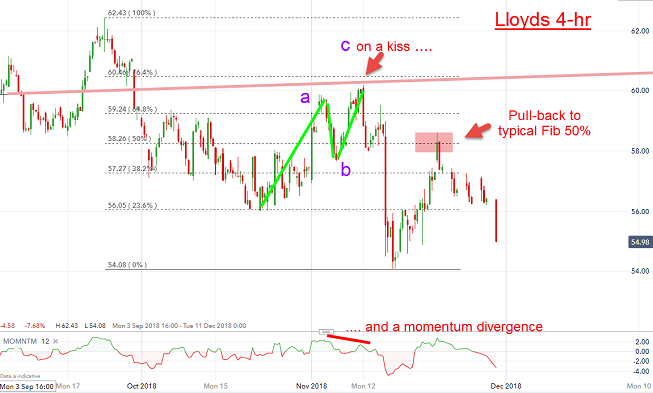
Since then, the market tried to rally but was repelled at the Fibonacci 50% resistance and is currently resuming its decline.
Source: interactive investor Past performances is not a guide to future performance
The bottom line: Lloyds remains in a bear trend with major US banks downgrading their European 'colleagues' with Deutsche Bank one of the hardest hit (it has problems of its own). Those bad loans they carry are set to get a whole lot worse.
For more information about Tramline Traders, or to take a three-week free trial, go to www.tramlinetraders.com.
John Burford is the author of the definitive text on his trading method, Tramline Trading. He is also a freelance contributor and not a direct employee of interactive investor.
These articles are provided for information purposes only. Occasionally, an opinion about whether to buy or sell a specific investment may be provided by third parties. The content is not intended to be a personal recommendation to buy or sell any financial instrument or product, or to adopt any investment strategy as it is not provided based on an assessment of your investing knowledge and experience, your financial situation or your investment objectives. The value of your investments, and the income derived from them, may go down as well as up. You may not get back all the money that you invest. The investments referred to in this article may not be suitable for all investors, and if in doubt, an investor should seek advice from a qualified investment adviser.
Full performance can be found on the company or index summary page on the interactive investor website. Simply click on the company's or index name highlighted in the article.
Disclosure
We use a combination of fundamental and technical analysis in forming our view as to the valuation and prospects of an investment. Where relevant we have set out those particular matters we think are important in the above article, but further detail can be found here.
Please note that our article on this investment should not be considered to be a regular publication.
Details of all recommendations issued by ii during the previous 12-month period can be found here.
ii adheres to a strict code of conduct. Contributors may hold shares or have other interests in companies included in these portfolios, which could create a conflict of interests. Contributors intending to write about any financial instruments in which they have an interest are required to disclose such interest to ii and in the article itself. ii will at all times consider whether such interest impairs the objectivity of the recommendation.
In addition, individuals involved in the production of investment articles are subject to a personal account dealing restriction, which prevents them from placing a transaction in the specified instrument(s) for a period before and for five working days after such publication. This is to avoid personal interests conflicting with the interests of the recipients of those investment articles.