Chart of the week: Is Vodafone now back in rally mode?
17th December 2018 12:37
by John Burford from interactive investor
After a long and well-documented bear phase, technical analyst John Burford explains what he thinks will happen next and how to trade the shares.

I last covered Vodafone on 10 September when I suggested it was near a major low at the £1.64 area following a lengthy bear phase. But in fact, it had a little more work to do on the downside first and reached the recent low of £1.42 before staging a recovery.
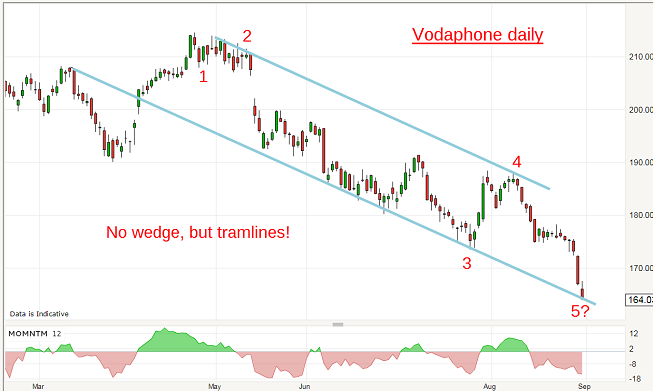
And this is how I handled that event. This was the chart I showed last time:
Source: interactive investor Past performance is not a guide to future performance
I had decent tramlines working and the market had pushed down to meet the lower support line. This was a good candidate for a low and this is what I wrote then:
"At least, I have now the basis for a renewed bullish stance and crucially, a low risk trade where a stop loss can be set under the low at the £1.62 area".
Shortly thereafter, the market completely ignored my analysis and proceeded to move lower and took me out at my stop at £1.62. That was a minor loss – and was planned in advance (a most crucial strategy).
By setting a sensible stop, a trader can have peace of mind that even if touched, the stop would protect him/her from a major loss. Being prepared to take a small loss means the trader reduces the worry level. And that's a good place to be.
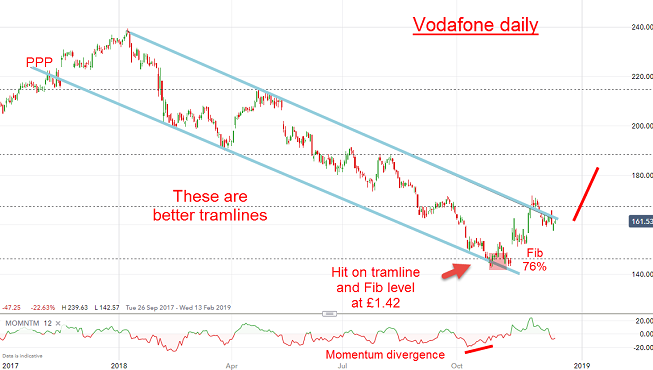
So this is the current daily chart:
Source: interactive investor Past performance is not a guide to future performance
I have re-drawn my tramline pair to fit the highs/lows better and the £1.42 low was a direct hit on the meeting of the lower tramline and the Fibonacci 76% retrace of the swing off the September 2002 low at £0.77 to the June 2015 high at £2.57. Support at this level is therefore strong.
With the momentum divergence at that low, the market was then poised for a rally in textbook form. And that is precisely what occurred. A buy around the £1.42 level was therefore indicated with a close stop loss set just below £1.40.
So now the shares have moved smartly up to the upper tramline resistance. A hard push above it would confirm the start of a more protracted rally phase.
Note that last time, I pencilled in a move up to the £1.76 area and on 28 November, it hit the £1.72 level and is currently consolidating the advance.
My next target is the £1.90 area. Only a move down to the £1.40 region would force me to re-assess.
For more information about Tramline Traders, or to take a three-week free trial, go to www.tramlinetraders.com.
*Horizontal lines on charts represent levels of previous technical support and resistance.
John Burford is the author of the definitive text on his trading method, Tramline Trading. He is also a freelance contributor and not a direct employee of interactive investor.
These articles are provided for information purposes only. Occasionally, an opinion about whether to buy or sell a specific investment may be provided by third parties. The content is not intended to be a personal recommendation to buy or sell any financial instrument or product, or to adopt any investment strategy as it is not provided based on an assessment of your investing knowledge and experience, your financial situation or your investment objectives. The value of your investments, and the income derived from them, may go down as well as up. You may not get back all the money that you invest. The investments referred to in this article may not be suitable for all investors, and if in doubt, an investor should seek advice from a qualified investment adviser.
Full performance can be found on the company or index summary page on the interactive investor website. Simply click on the company's or index name highlighted in the article.
Disclosure
We use a combination of fundamental and technical analysis in forming our view as to the valuation and prospects of an investment. Where relevant we have set out those particular matters we think are important in the above article, but further detail can be found here.
Please note that our article on this investment should not be considered to be a regular publication.
Details of all recommendations issued by ii during the previous 12-month period can be found here.
ii adheres to a strict code of conduct. Contributors may hold shares or have other interests in companies included in these portfolios, which could create a conflict of interests. Contributors intending to write about any financial instruments in which they have an interest are required to disclose such interest to ii and in the article itself. ii will at all times consider whether such interest impairs the objectivity of the recommendation.
In addition, individuals involved in the production of investment articles are subject to a personal account dealing restriction, which prevents them from placing a transaction in the specified instrument(s) for a period before and for five working days after such publication. This is to avoid personal interests conflicting with the interests of the recipients of those investment articles.