Chart of the Week: Is Vodafone on the way back?
10th September 2018 12:36
by John Burford from interactive investor
The fortunes of Vodafone continue to capture the attention of technical analyst John Burford, who senses better times are around the corner for the phone giant.

I have been following this much-derided share since 30 July, when I suggested they were approaching a major low and about to turn.
However in my Vodafone update from last week, I conceded that I had been somewhat premature in my bullish stance as the mobile phone giant dropped further to a low in the £1.64 region.
I also explained last week how I handle a losing situation so that a small loss doesn't develop into a large one.
I believe that being expert at handling your losing (and winning!) open trades is a significantly more useful skill than picking 'winners'. After all, how many 'winners' turn out to be so?
So today, I will follow up the drama as I am hoping this example will act as an object lesson in how to develop a winning attitude, despite taking small losses along the way.
This was the chart I posted on 4 September:
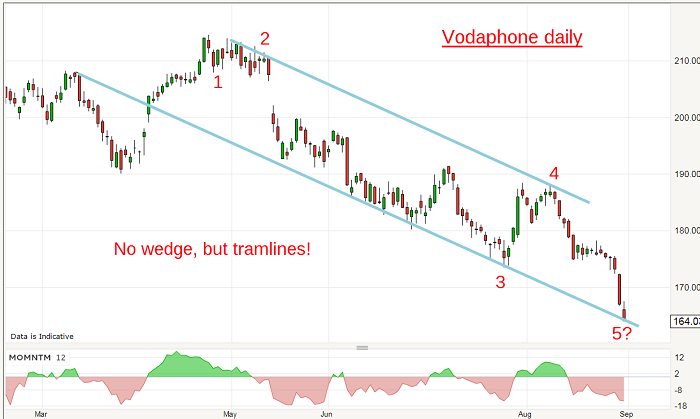
Source: interactive investor Past performance is not a guide to future performance
I noted the new tramlines with the lower one possessing a Prior Pivot Point (PPP), which is the high of 8 March and at least five accurate touch points including the wave 3 low.
My pencilled-in wave 5 low also lay on it, so odds were good the tramline support should provide a base for a rally of some kind.
But without this Elliott wave framework (that gives high probability forecasts for important reversals), how many traders/investors would just give up and conclude it's still in a bear market and going lower?
And this is what I wrote last week:
"In fact, the wedge has gone and I now have a good tramline pair (with parallel lines) where the upper line clips the wave 4 high.
If this level at £1.64 can hold, we may have a base for the rally phase I had originally pencilled in back in July. But what is spoiling this picture is the lack of a momentum divergence. That may be crucial."
So has this tramline support held so far? Here is the latest 2-hour chart showing the final fifth wave:
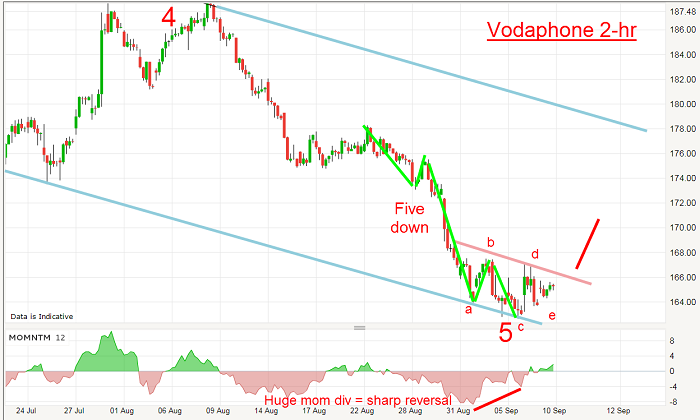
Source: interactive investor Past performance is not a guide to future performance
In fact, the chart has traced out a superb textbook mini-five wave pattern with a very large momentum divergence at the low that signals a reversal is back on the cards.
A break above the pink mini trendline would help confirm this bullish scenario and project a move up to at least the £1.76 area with higher potential.
At least, I have now the basis for a renewed bullish stance and crucially, a low risk trade where a stop loss can be set under the low at the £1.62 area.
John Burford is the author of the definitive text on his trading method, Tramline Trading. He is also a freelance contributor and not a direct employee of interactive investor.
These articles are provided for information purposes only. Occasionally, an opinion about whether to buy or sell a specific investment may be provided by third parties. The content is not intended to be a personal recommendation to buy or sell any financial instrument or product, or to adopt any investment strategy as it is not provided based on an assessment of your investing knowledge and experience, your financial situation or your investment objectives. The value of your investments, and the income derived from them, may go down as well as up. You may not get back all the money that you invest. The investments referred to in this article may not be suitable for all investors, and if in doubt, an investor should seek advice from a qualified investment adviser.
Full performance can be found on the company or index summary page on the interactive investor website. Simply click on the company's or index name highlighted in the article.
Disclosure
We use a combination of fundamental and technical analysis in forming our view as to the valuation and prospects of an investment. Where relevant we have set out those particular matters we think are important in the above article, but further detail can be found here.
Please note that our article on this investment should not be considered to be a regular publication.
Details of all recommendations issued by ii during the previous 12-month period can be found here.
ii adheres to a strict code of conduct. Contributors may hold shares or have other interests in companies included in these portfolios, which could create a conflict of interests. Contributors intending to write about any financial instruments in which they have an interest are required to disclose such interest to ii and in the article itself. ii will at all times consider whether such interest impairs the objectivity of the recommendation.
In addition, individuals involved in the production of investment articles are subject to a personal account dealing restriction, which prevents them from placing a transaction in the specified instrument(s) for a period before and for five working days after such publication. This is to avoid personal interests conflicting with the interests of the recipients of those investment articles.