Chart of the week: why 50% slump might signal time to buy Tesla
21st June 2022 15:26
by John Burford from interactive investor
There could be a recession coming, but technical analyst John Burford has spotted a signal to expect a sharp recovery in this stock. Here’s the thinking behind this bold call.

Tesla (NASDAQ:TSLA) has been having a torrid time lately, from mass layoffs to questions over battery raw materials supplies to the general tech rout that has lopped a cool 35% off the Nasdaq index since its November all-time high.
There is little question that general economic conditions have deteriorated sharply this year, with the well-rehearsed cost-of-living crisis that is manifesting in the sudden emergence of industrial strikes in the UK and US. This will, of course, impact GDP numbers later. Oh, and interest rates are being pushed upwards eagerly by the Federal Reserve (but very gingerly by the Bank of England).
In this time, Tesla shares have lost a little over 50% in value, with sentiment sharply negative and many predicting a recession later this year that should in theory cut demand for the very expensive electric vehicles the company produces.
While there may not be blood on the streets, a 50% discount with sentiment at rock bottom has my contrarian antennae twitching jerkily. So what does the chart tell us?
This is the long-term weekly chart showing the incredible bull run from the depths of the 2019 lows to the all-time high in November:
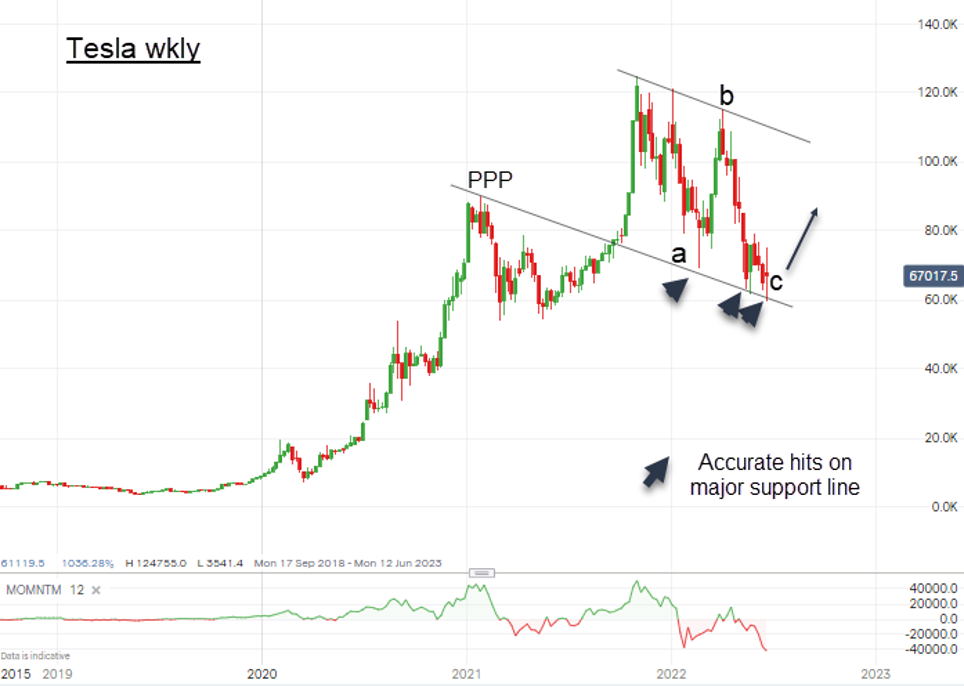
Past performance is not a guide to future performance.
The key feature is the lovely tramlines the market display.
The upper line joins all the highs and the parallel lower line starts at the Prior Pivot Point (PPP) at the January 2021 top and joins all of the lows – including the crucial low made only last Thursday at $625. And at that low, the decline off the high measured a very near Fibonacci 50%.
And a correction of that magnitude is very often terminal.
- Tesla and the electric car revolution
- Want to buy and sell international shares? It’s easy to do. Here’s how
Thus, not only have the shares met a solid line of support at the lower tramline, but has also made a Fibonacci 50% correction – a double reason to suspect a major low is in at the $625 print last week.
Let's take a look at the recent action on the daily chart now:
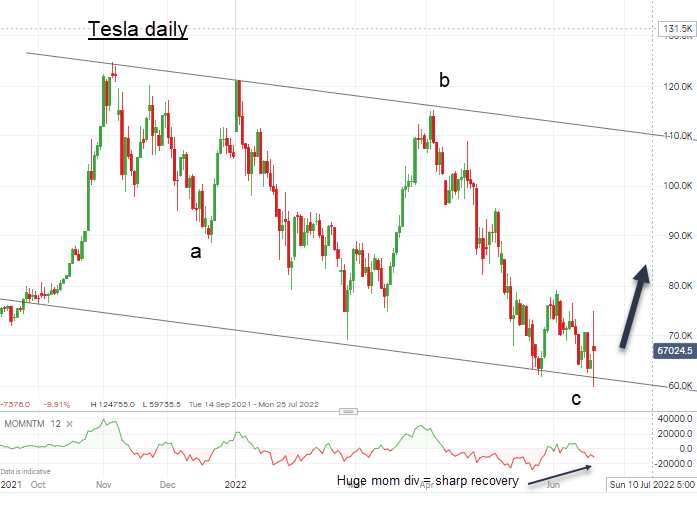
Past performance is not a guide to future performance.
I have slightly different a-b-c labels but the message is the same – a three wave correction leading to a renewed bull run. And note the large momentum divergence at Thursday's low – a signal to expect a sharp recovery.
If correct, my first target is the $900 region with higher potential. Only a sharp decline past the $625 low would send me back to the drawing board.
Many news-directed investors are probably scratching their heads at my bullish analysis. After all, the economy appears to be on a downward trajectory with the outlook for shares such as Tesla grim. If that scenario appears obvious, let me recall an old market maxim: 'If something is obvious to the majority, then it's obviously wrong'.
John Burford is a freelance contributor and not a direct employee of interactive investor.
These articles are provided for information purposes only. Occasionally, an opinion about whether to buy or sell a specific investment may be provided by third parties. The content is not intended to be a personal recommendation to buy or sell any financial instrument or product, or to adopt any investment strategy as it is not provided based on an assessment of your investing knowledge and experience, your financial situation or your investment objectives. The value of your investments, and the income derived from them, may go down as well as up. You may not get back all the money that you invest. The investments referred to in this article may not be suitable for all investors, and if in doubt, an investor should seek advice from a qualified investment adviser.
Full performance can be found on the company or index summary page on the interactive investor website. Simply click on the company's or index name highlighted in the article.
Disclosure
We use a combination of fundamental and technical analysis in forming our view as to the valuation and prospects of an investment. Where relevant we have set out those particular matters we think are important in the above article, but further detail can be found here.
Please note that our article on this investment should not be considered to be a regular publication.
Details of all recommendations issued by ii during the previous 12-month period can be found here.
ii adheres to a strict code of conduct. Contributors may hold shares or have other interests in companies included in these portfolios, which could create a conflict of interests. Contributors intending to write about any financial instruments in which they have an interest are required to disclose such interest to ii and in the article itself. ii will at all times consider whether such interest impairs the objectivity of the recommendation.
In addition, individuals involved in the production of investment articles are subject to a personal account dealing restriction, which prevents them from placing a transaction in the specified instrument(s) for a period before and for five working days after such publication. This is to avoid personal interests conflicting with the interests of the recipients of those investment articles.