Chart of the week: will Apple’s share price test previous highs?
Our chartist thinks its future looks bright for the tech giant ahead of its Q4 earnings report.
26th October 2020 13:43
by John Burford from interactive investor
Tech giant is due to release an earnings report this week, and our chartist thinks its future looks bright.

Apple (NASDAQ:AAPL) critical pandemic-affected fiscal Q4 earnings report is set to be issued on 29 October – and will be carefully scrutinised by analysts, as usual. Since I am a technical analyst, I am relieved of that chore – thank goodness!
I have never been accused of poring over a single spreadsheet in my life, but rely on the beautiful pictures and patterns revealed in the price charts. For me, almost everything I need to know is contained there.
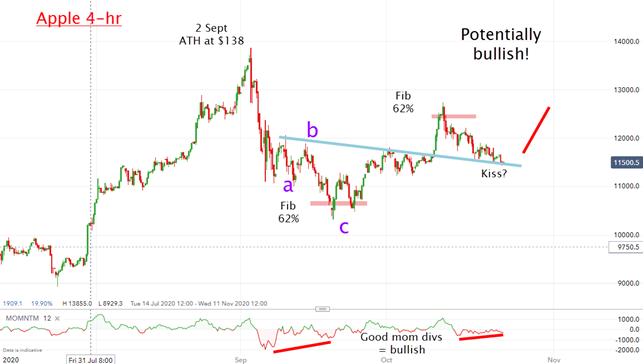
And the Apple charts do appear to be poised for another move higher, despite possible short-term volatility. Here is the four-hour chart showing the form of the decline off the 2 September all-time high (ATH):
Source: interactive investor. Past performance is not a guide to future performance.
I see a clear three down off the ATH with a large momentum divergence that usually signals a sharp reversal, which is in progress.
Last week, the market came down off the Fibonacci 62% retrace of the previous wave to touch my blue trendline in what may be a typical ‘kiss’ before shooting higher in a ‘scalded cat bounce’.
So that is my most bullish scenario that will apply if or when the market resumes its uptrend from here around the $114 (£84.5) mark. That should occur this week.
The alternate scenario is for the market to drop sharply below the blue trendline making this a line of crucial short-term importance. So now, we have a line in the sand at the $114 area that we can use to set a sensible stop loss if my bullish scenario is wrong.
- Apple valued at $2 trillion – but can the US boom last?
- Take control of your retirement planning with our award-winning, low-cost Self-Invested Personal Pension (SIPP)
For traders, having such a technically important point is extremely useful since it has a logical basis based on the chart patterns displayed.
The blue trendline is valid as a line of short-term support since it possesses several very accurate touch points when it was a line of resistance.
But of course, no forecast can possibly be 100% reliable – we work with the odds of success for various scenarios. And. to my mind, the bullish outlook appears most favourable, and I have a low risk trade.
For more information about Tramline Traders, or to take a three-week free trial, go to www.tramlinetraders.com.
John Burford is the author of the definitive text on his trading method, Tramline Trading. He is also a freelance contributor and not a direct employee of interactive investor.
These articles are provided for information purposes only. Occasionally, an opinion about whether to buy or sell a specific investment may be provided by third parties. The content is not intended to be a personal recommendation to buy or sell any financial instrument or product, or to adopt any investment strategy as it is not provided based on an assessment of your investing knowledge and experience, your financial situation or your investment objectives. The value of your investments, and the income derived from them, may go down as well as up. You may not get back all the money that you invest. The investments referred to in this article may not be suitable for all investors, and if in doubt, an investor should seek advice from a qualified investment adviser.
Full performance can be found on the company or index summary page on the interactive investor website. Simply click on the company's or index name highlighted in the article.
Disclosure
We use a combination of fundamental and technical analysis in forming our view as to the valuation and prospects of an investment. Where relevant we have set out those particular matters we think are important in the above article, but further detail can be found here.
Please note that our article on this investment should not be considered to be a regular publication.
Details of all recommendations issued by ii during the previous 12-month period can be found here.
ii adheres to a strict code of conduct. Contributors may hold shares or have other interests in companies included in these portfolios, which could create a conflict of interests. Contributors intending to write about any financial instruments in which they have an interest are required to disclose such interest to ii and in the article itself. ii will at all times consider whether such interest impairs the objectivity of the recommendation.
In addition, individuals involved in the production of investment articles are subject to a personal account dealing restriction, which prevents them from placing a transaction in the specified instrument(s) for a period before and for five working days after such publication. This is to avoid personal interests conflicting with the interests of the recipients of those investment articles.