Chart of the week: will bank’s rally continue?
High-street bank shares are improving - especially Lloyds.
16th November 2020 13:12
by John Burford from interactive investor
High-street bank shares are improving - especially Lloyds. Our chartist says investors may be able to ‘buy the dips’.

When I posted my bullish comments about banks in my recent August and October articles I was definitely swimming against the tide of opinion.
The shares were plumbing new depths as loan margins – the lifeblood of banks’ earnings – were squeezed wafer-thin as interest rates were destined to “stay lower for longer”, or so the story went.
And in recent days even the Bank of England has been publicly hinting that their policy rates may become negative, and they advised retail banks to prepare for this.
Adding to this mixture of negatives is the widespread belief that the economy will be heading lower next year. Part of this is that unemployment levels rising again, with major disruptions in the travel and hospitality sectors especially.
So did buying bank shares make any sense when there were so many “obvious” reasons not to do so?
But as my long-time readers will know, this is precisely the time when major reversals can pop up, since major lows occur when sentiment has reached extreme despair.
- Time to bank these buying opportunities
- Chart of the week: are ailing UK banks poised to rebound?
- ii view: Lloyds Bank profit surprises to the upside
Most of the “known” bearish factors have been in the market for some time and only a small degree of buying power (from bargain hunters?) can set off a decent rally phase.
And these situations present very attractive reward/risk scenarios. There is little danger of the major banks going bust, and with long-term yields now on the rise, short-term rates will follow – and boost loan margins, which is contrary to the common view.
That seems to be what is happening now. In my column of 5 October I posted this chart, which acts as my road map:
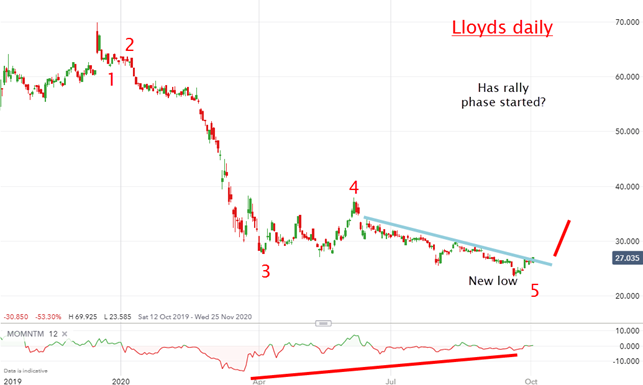
Source: interactive investor. Past performance is not a guide to future performance.
I concluded that there was a very high probability for a new rally phase off the “new low” of 24p. That print qualified as the termination of wave five, and given the large momentum divergence there was a likely prelude to a sharp recovery.
As of Friday, the market has traded higher to the 35p mark, which is a handy 11p (46%) gain off the “new low” and at a five-month high.
- Are Lloyds Bank and Tesco on list of best value stocks to buy?
- Take control of your retirement planning with our award-winning, low-cost Self-Invested Personal Pension (SIPP)
Even small moves often result in large percentage gains – and that is one of the features of trading low-price shares. Of course, it works both ways!
Early birds now have very good long positions, and the question is this: is there any more upside or is this just a bear market rally, AKA a dead cat bounce?
While I cannot give a definitive answer, it seems the odds favour a continuation of the rally, of course punctuated by dips, and these I suggest would be worth buying.
An important gap has just been closed (just below the wave four high) and usually prices move lower after that. If so, that dip would be a great opportunity.
For more information about Tramline Traders, or to take a three-week free trial, go to www.tramlinetraders.com.
John Burford is the author of the definitive text on his trading method, Tramline Trading. He is also a freelance contributor and not a direct employee of interactive investor.
These articles are provided for information purposes only. Occasionally, an opinion about whether to buy or sell a specific investment may be provided by third parties. The content is not intended to be a personal recommendation to buy or sell any financial instrument or product, or to adopt any investment strategy as it is not provided based on an assessment of your investing knowledge and experience, your financial situation or your investment objectives. The value of your investments, and the income derived from them, may go down as well as up. You may not get back all the money that you invest. The investments referred to in this article may not be suitable for all investors, and if in doubt, an investor should seek advice from a qualified investment adviser.
Full performance can be found on the company or index summary page on the interactive investor website. Simply click on the company's or index name highlighted in the article.
Disclosure
We use a combination of fundamental and technical analysis in forming our view as to the valuation and prospects of an investment. Where relevant we have set out those particular matters we think are important in the above article, but further detail can be found here.
Please note that our article on this investment should not be considered to be a regular publication.
Details of all recommendations issued by ii during the previous 12-month period can be found here.
ii adheres to a strict code of conduct. Contributors may hold shares or have other interests in companies included in these portfolios, which could create a conflict of interests. Contributors intending to write about any financial instruments in which they have an interest are required to disclose such interest to ii and in the article itself. ii will at all times consider whether such interest impairs the objectivity of the recommendation.
In addition, individuals involved in the production of investment articles are subject to a personal account dealing restriction, which prevents them from placing a transaction in the specified instrument(s) for a period before and for five working days after such publication. This is to avoid personal interests conflicting with the interests of the recipients of those investment articles.