Chart of the week: are ailing UK banks poised to rebound?
High-street bank share prices could be at their lowest points, according to our chartist.
5th October 2020 12:40
by John Burford from interactive investor
High-street bank share prices could be at their lowest points, according to our chartist.

Let’s face it, bullish sentiment towards the banks is on the floor – as are their share prices. And that, in a nutshell, is how markets work.
Bear trends start from extreme bullishness and bull trends from extreme bearishness. Today, bearishness is extreme. I will let you draw your own conclusions from that observation!
Yes, taking a highly contrary position from the majority involves considerable intestinal fortitude – but that is the fate of those who desire to succeed.
The HSBC (LSE:HSBA) share price has now reached an historic point. The current bear phase started from January 2018 at £8 and the worsening outlook for banks drove the price to the current £3 area for a loss of a Fibonacci 62% (5/8).
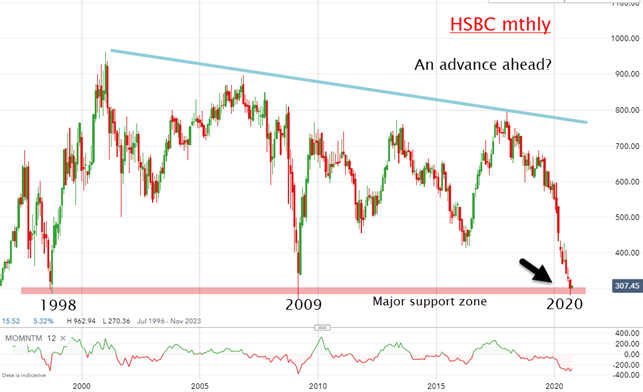
Source: interactive investor. Past performance is not a guide to future performance.
But that level brings it back to the two other major lows in 1998 and 2009. That represents major long-term support. But note that these major lows are eleven years apart.
Is this a coincidence? We have at least one other eleven-year cycle in nature – the sunspot cycle (currently at a minimum).
- Chart of the week: can rising bond yields help Lloyds?
- Chart of the week: do equinoxes really affect stock trends?
- Why reading charts can help you become a better investor
- Read more from our technical analysts here
Recently, I have referred to the equinox effect, where some markets seem to be ruled by annual motions of the earth around the sun. And because it is our sun that gives us all life (and hence the markets), is it a total stretch to believe the cycles of our sun (and earth) is a major influence on markets?
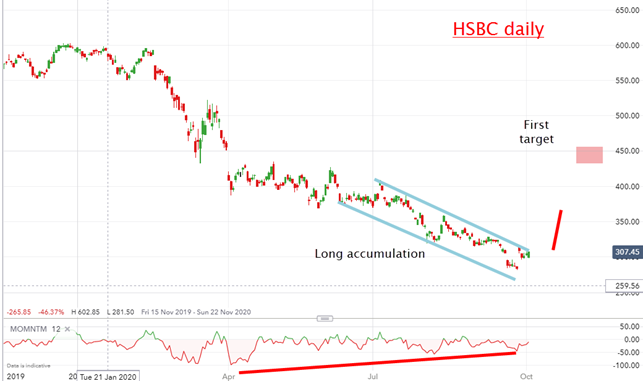
To determine if the short-term charts align with a bullish view, here is the daily:
Source: interactive investor. Past performance is not a guide to future performance.
As the market moved down to the current £3 area, selling momentum weakened – and buyers slowly took over. This has created a mammoth momentum divergence. Coming at the end of a sustained bear trend, this indicates a likely selling climax.
- Chart of the week: banks versus tech stocks
- Take control of your retirement planning with our award-winning, low-cost Self-Invested Personal Pension (SIPP)
Odds are very high a major low is here or very close. A sharp move up this week would indicate a likely move up to my first target around the £4.50 region. Only a hard break into new lows below £2.80 would amend my stance.
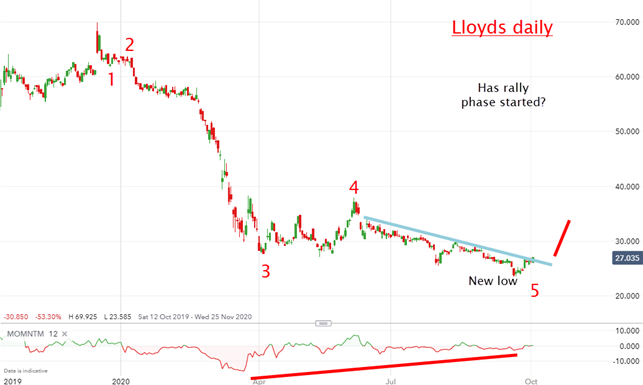
Another candidate for a surprise rally phase is Lloyds. I August I suggested a major low was at hand for the bank. The share price pattern has been similar to HSBC:
Source: interactive investor. Past performance is not a guide to future performance.
In my August article I suggested the low at the time should be the final fifth wave low, but allowed for one more new low. I wrote: “If there is more downside first, I do not see much potential for large losses. In fact, trading under the current 29p mark would set up an even better opportunity.”
In fact, it did make one more new low to the 24p mark and then reversed strongly. An advance above the minor blue trendline should ensure a move up to test the wave four high at 38p. We shall see.
For more information about Tramline Traders, or to take a three-week free trial, go to www.tramlinetraders.com.
John Burford is the author of the definitive text on his trading method, Tramline Trading. He is also a freelance contributor and not a direct employee of interactive investor.
These articles are provided for information purposes only. Occasionally, an opinion about whether to buy or sell a specific investment may be provided by third parties. The content is not intended to be a personal recommendation to buy or sell any financial instrument or product, or to adopt any investment strategy as it is not provided based on an assessment of your investing knowledge and experience, your financial situation or your investment objectives. The value of your investments, and the income derived from them, may go down as well as up. You may not get back all the money that you invest. The investments referred to in this article may not be suitable for all investors, and if in doubt, an investor should seek advice from a qualified investment adviser.
Full performance can be found on the company or index summary page on the interactive investor website. Simply click on the company's or index name highlighted in the article.
Disclosure
We use a combination of fundamental and technical analysis in forming our view as to the valuation and prospects of an investment. Where relevant we have set out those particular matters we think are important in the above article, but further detail can be found here.
Please note that our article on this investment should not be considered to be a regular publication.
Details of all recommendations issued by ii during the previous 12-month period can be found here.
ii adheres to a strict code of conduct. Contributors may hold shares or have other interests in companies included in these portfolios, which could create a conflict of interests. Contributors intending to write about any financial instruments in which they have an interest are required to disclose such interest to ii and in the article itself. ii will at all times consider whether such interest impairs the objectivity of the recommendation.
In addition, individuals involved in the production of investment articles are subject to a personal account dealing restriction, which prevents them from placing a transaction in the specified instrument(s) for a period before and for five working days after such publication. This is to avoid personal interests conflicting with the interests of the recipients of those investment articles.